Note: The Histogram tool is available in both the Capture and the Review tabs and functions the
same way.
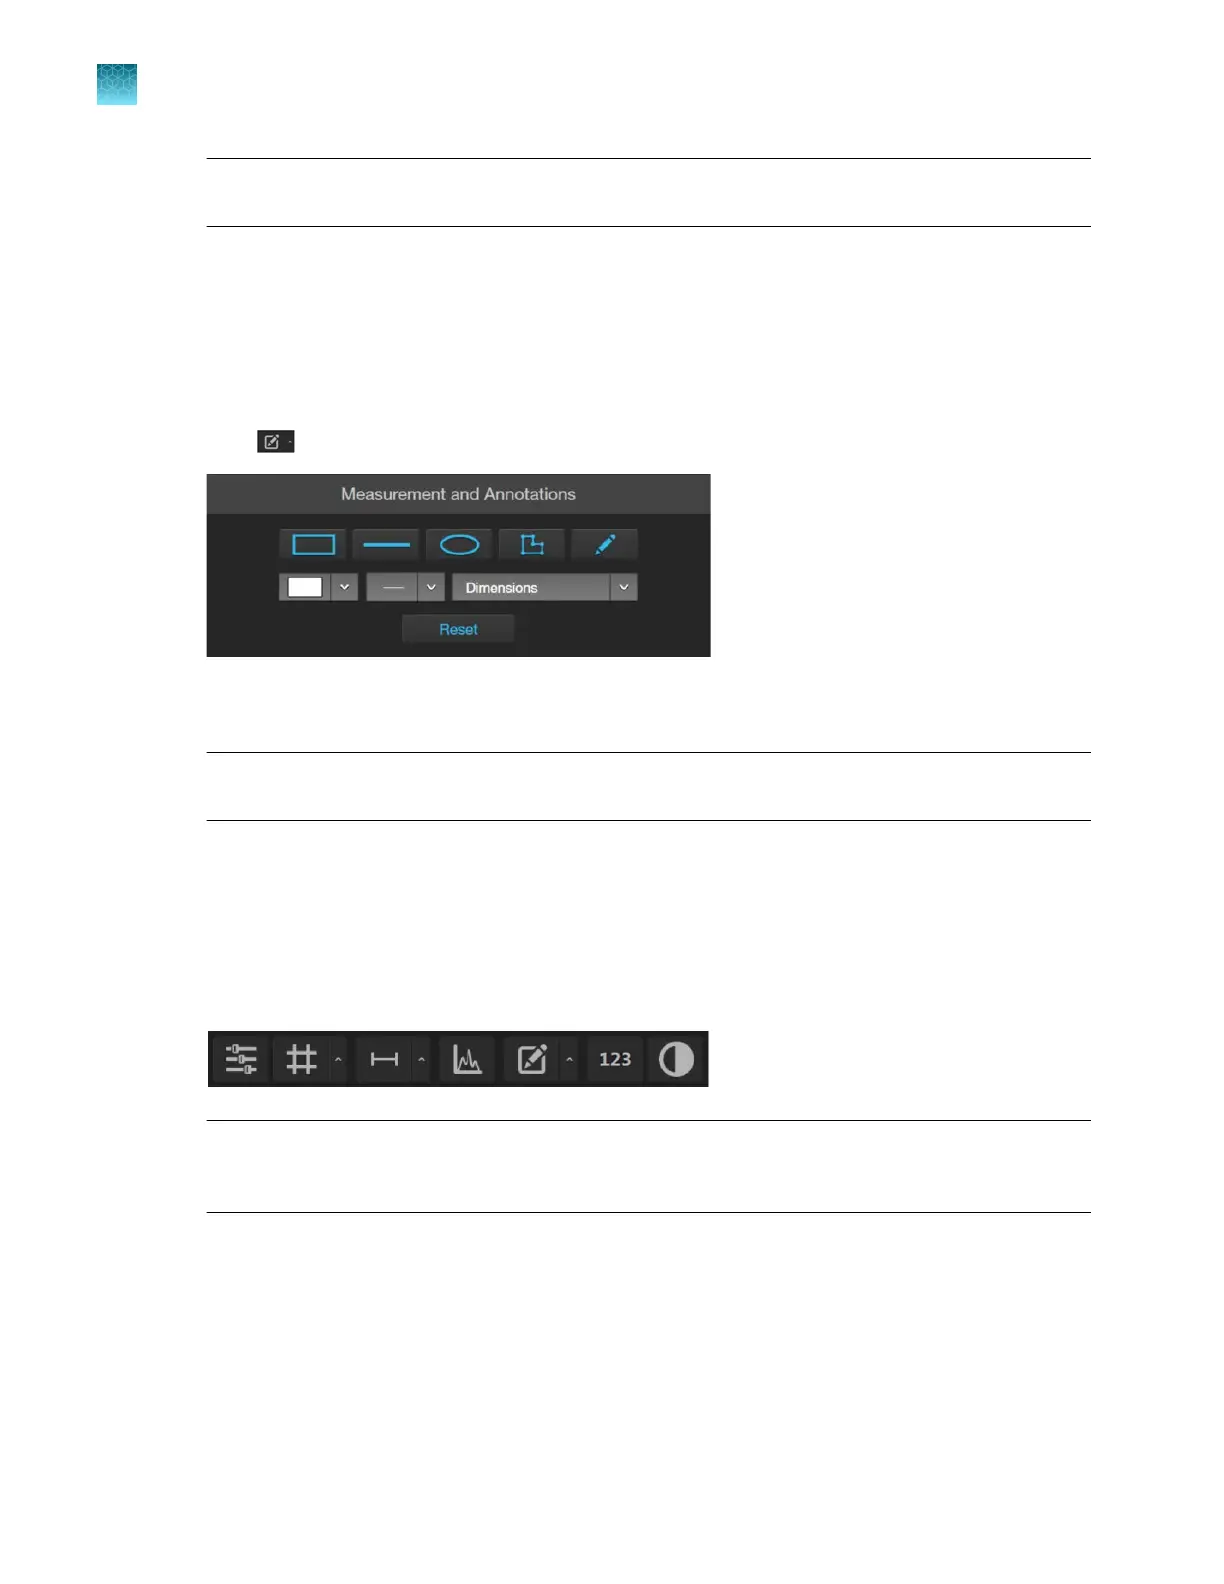
Add measurements and annotations to saved images
1.
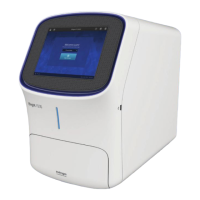
Hover the pointer over the Viewing area to reveal the buttons for Display Settings and Analysis
Tools at the bottom of the screen.
2.
Click (Measurement and Annotations) to open the measurement and annotations tools.
For instructions on how to add and show measurements and annotations to your images, see “Add
measurements and annotations” on page42.
Note: Measurement and Annotations tools are available in both the
Capture and Review tabs
and functions the same way.
Analyze cell culture using saved images
1.
Hover the pointer over the Viewing area to reveal Display Settings and Analysis Tools, then click
123 (Show Cell Count) to display Auto Count, Manual Count, and Cell Culture options below
the Capture tab.
IMPORTANT! For analysis, only use 16-bit image files
(TIFF or PNG). The 16-bit images of
individual channels contain the full dynamic range and metadata needed for quantitative analysis,
whereas Display image files do not.
Chapter10Review and analyze saved images
Add measurements and annotations to saved images
10
90
EVOS
™
M5000 Imaging System User Guide