Display grid
•
Click (Grid) to superimpose a grid over the Viewing area. For instructions on how to change
the Grid settings, see “Display grid” on page38.
Display scale bar
•
Click (Scale Bar) to superimpose a scale bar over the Viewing area. For instructions on how to
change scale bar settings, see “Display scale bar” on page39.
View pixel intensity histogram
Display histogram
1.
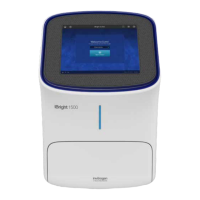
Hover the pointer over the Viewing area to reveal the buttons for Display Settings and Analysis
Tools.
2.
Click (Histogram) to open the Intensity Histogram plot.
The Pixel Intensity histogram shows the Pixel count vs. Intensity data of the image displayed in the
V
iewing area as well as the minimum, mean, and maximum pixel intensities. See “Align channels”
on page40 for more information on the Histogram tool.
Chapter10Review and analyze saved images
View pixel intensity histogram
10
EVOS
™
M5000 Imaging System User Guide
89