4.
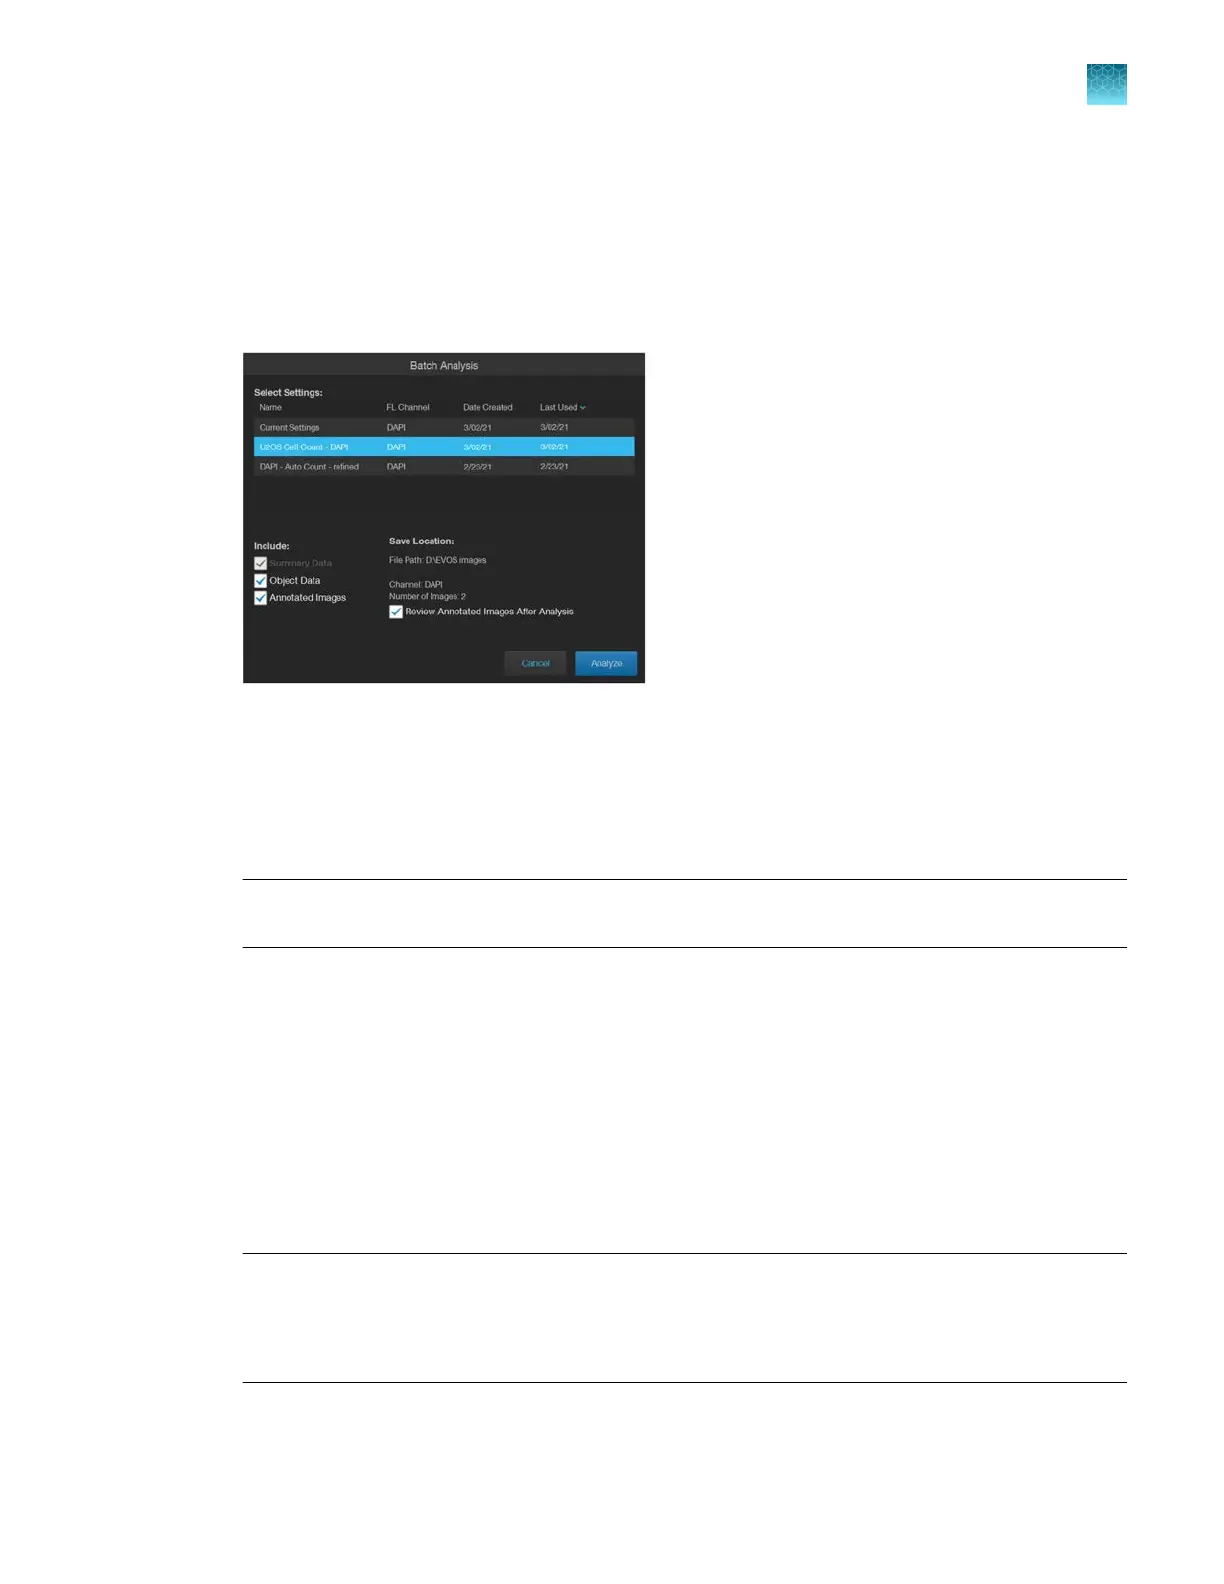
Select the Settings to use for Batch Analysis.
•
To use the current analysis settings (that is, analysis parameters that you have used in Step 2
on page94), select Current Settings.
•
To use previously saved analysis settings, select the desired option from the Select Settings
list. You can sort the list by fluorescence channel, date created, or last date used.
In this example, the previously saved U2OS Cell Count - DAPI setting is selected.
5.
To save the
Intensity, Area, and Circularity data of objects counted in Auto Count, select Object
Data. When Object Data is selected, the data is saved as separate CSV files for each analyzed
image in the analysis folder. The option to save Object Data is available only for Auto Count.
6.
To embed the measurements from the batch analysis in the images so that you can compare them
aft
er the analysis, select Annotated Images.
Note: Summary Data is always selected. After the analysis, summary data is included in the
analysis folder as a separate CSV file.
7.
To review the annotated images immediately after the analysis is complete, select Review
Annotated Images After Analysis.
8.
Click
Analyze to run batch analysis using the selected settings.
The software applies the analysis parameters used for the representative image to all the images in
the image folder.
When batch analysis is completed, the software saves the analysis results in a separate folder in
the same location as the analyzed images.
If Review Annotated Images After Analysis is selected, the software switches to the Review
mode and displays the list of analyzed images in the Review panel.
Note:
The analysis folder is named using the following format:
Batch <AnalysisDate><Unique Analysis ID>
For example, Batch 2021-03-02T112538
The images in the analysis folder retain their original name, but they are given the prefix AN_.
Chapter10Review and analyze saved images
Batch analysis
10
EVOS
™
M5000 Imaging System User Guide
95