96 User Manual QuickTOC
®
purity
ATEX 2 04E3920
7 How to Work With the Analyser
7.2 Configuration LAR | PROCESS ANALYSERS AG
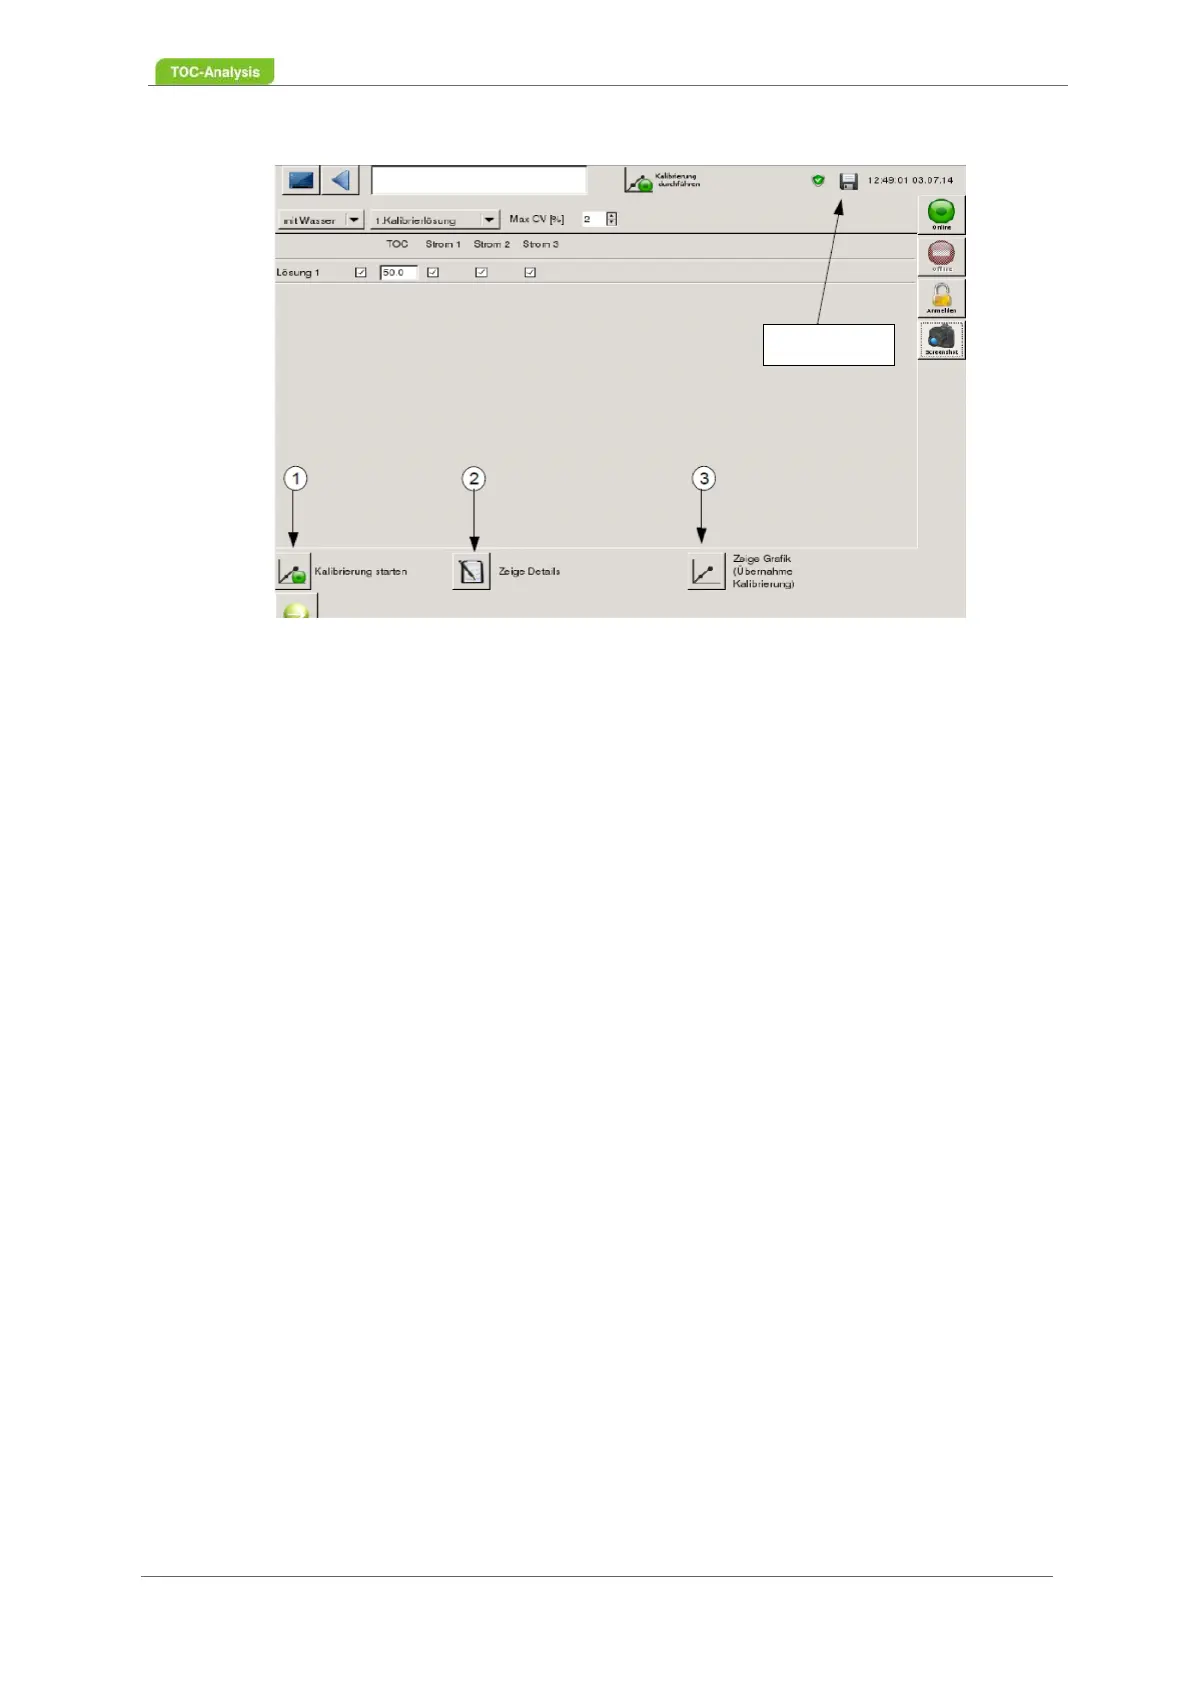
Fig. 57: Perform Calibration Screen (Example)
In this screen, a one-point calibration or a multi-point calibration for a stream can be performed. For a
multi-point calibration, it must be noted that the calibration solutions can only be measured one after the
other.
• Show details (2)
First, a calibration must be performed to enable this button. Click the button to see a more detailed
view of the raw values of the solutions, currents, and signals . Outliers are automatically highlighted
in yellow and are not included in the calculation.
• Show graphic (3)
First, a calibration must be performed to enable this button. To view the calibration graph (Fig. 57,
page 103), the "Show graph" key must be pressed. The current (blue curve) and the new calibration
graph (red curve) are shown in this graph. To go back to the start of calibration, press the "Back to
Start Calibration" button. •
• Back to the start of calibration (1)
This key returns you to the "Start Calibration" view. This button can only be clicked when it is in the
"Show Details" or "Show Graph" view.
7.2.4.1.1 Perform a 1-point calibration for a sample stream
1. Preparation of the calibration solution and positioning of the calibration vessel.
2. In the selection box "Calibration solutions" the number of calibration solutions can be selected.
After selecting the number of solution, this quantity will be displayed on the screen.
3. The maximum CV can be entered in% for the calibration.
4. Between solution and stream there are input fields for the concentration of the solution. Enter all
ingredients of the solution in the table. To make an entry: Click in the input field. A number pad and
keyboard will appear. Please enter the concentration (in ppm).
5. To accept the new calibration concentration, save it with the floppy disk symbol (Fig. 57, page 96).
6. Activate the check box for the sample stream and the solution.
7. Now the calibration can be started with the button "Start calibration".
8. Raw values can be viewed in the next screen using the Show Details button.
9. All check boxes in the "Show Details" screen are enabled for the performed solution and the
sample stream. Outliers are detected by the software and highlighted in yellow. These outliers are
not included in the calculation.
10. Thereafter, the new calibration graph can be viewed in the "Display Graph" screen with the
Save button