04E3920 User Manual QuickTOC
®
purity
ATEX 2 105
7 How to Work With the Analyser
7.2 Configuration
LAR | PROCESS ANALYSERS AG
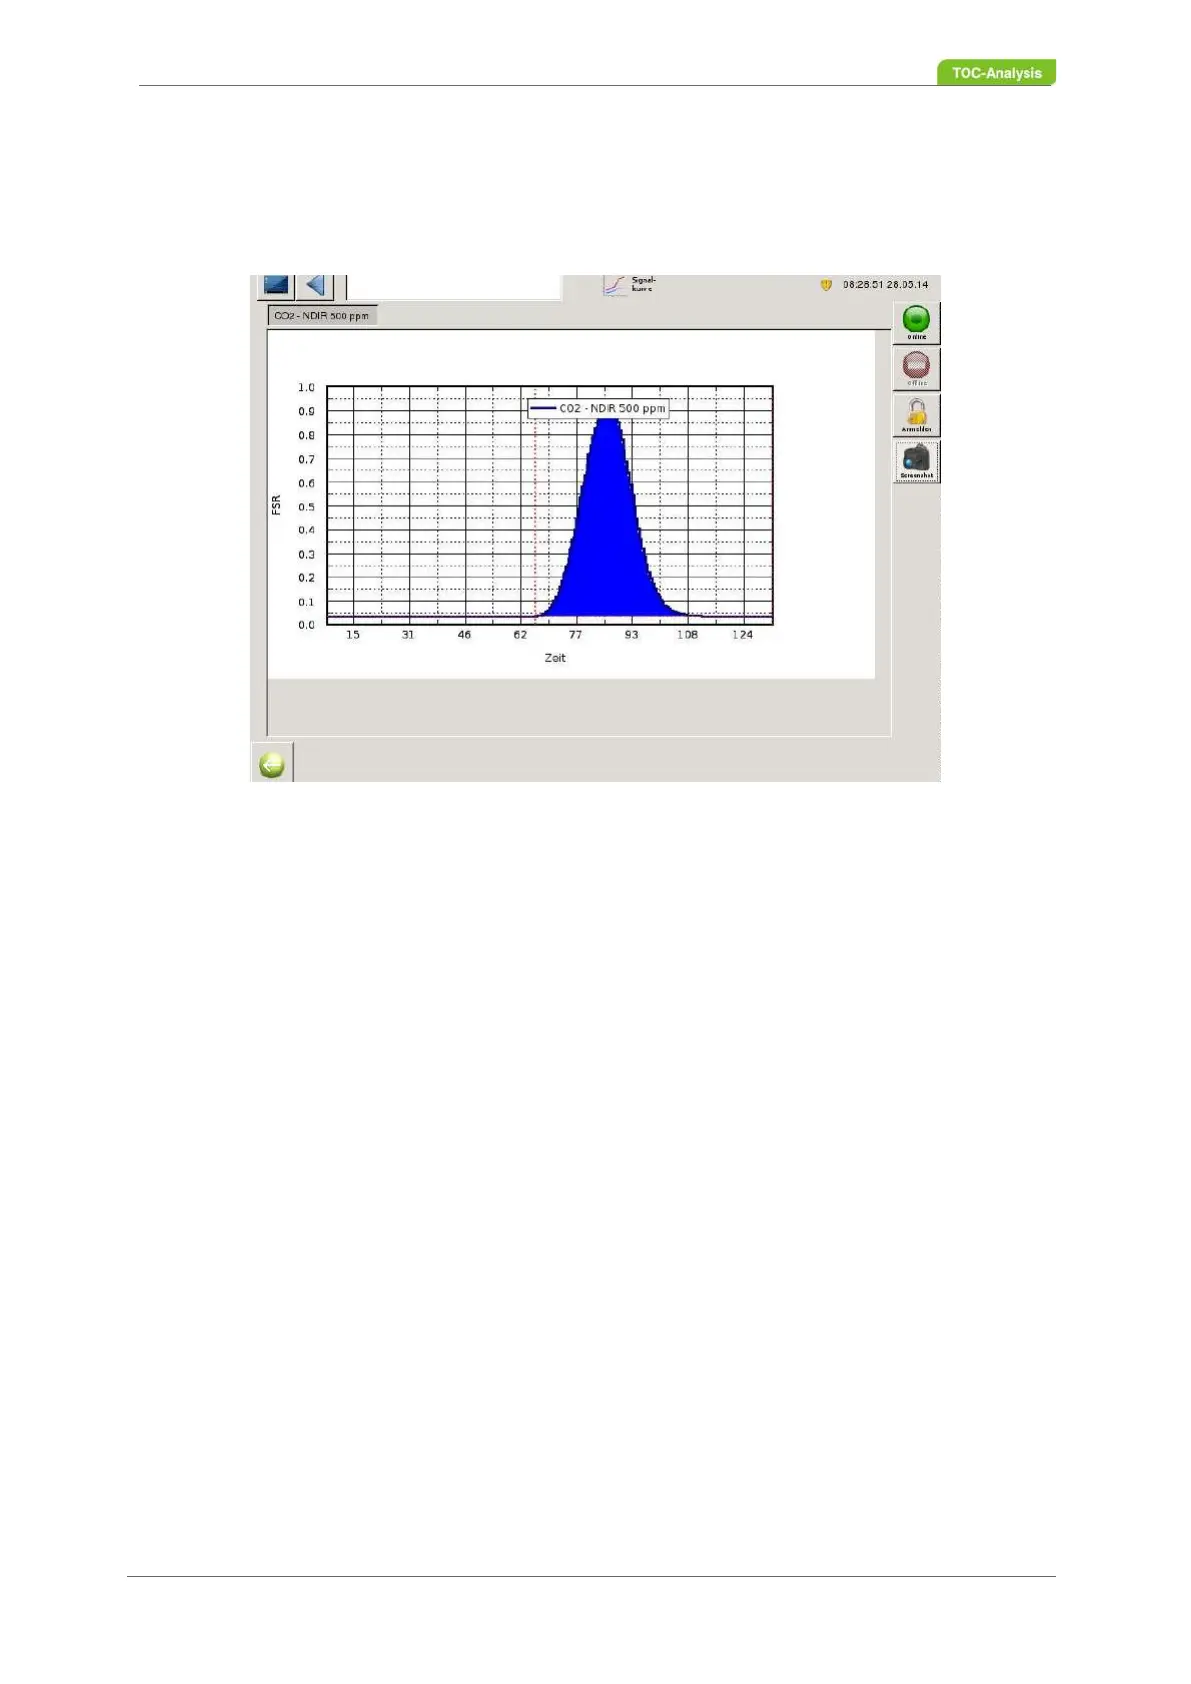
7.2.10 Signal Curve
To view the measurement curve, go to the "Signal Curve" view in Level II. If the analyser has more than
one sensor, the detector can be selected on the upper left side of the screen.
Fig. 68: Signal Curve (Example)
7.2.11 Status Screen
In this two-part screen, the right-hand window provides an overview of the current status of the device.
In the left-hand window, the previous values can be viewed.
If further sample streams are installed in the analyser, the measured values of all existing sample
streams can be displayed here.
To view the measured values of another sample stream, press the "Current" button. Next to these selec-
tion windows, the time of the next measurement is displayed for each sample stream. Column 1 shows
the time [hh: min: sec] of the measurement. Column 2 shows the measured values. Other columns show
more parameters (e.g., TNb, COD, etc.).
The following parameters are displayed in the top right-hand window:
• Oven status (on / off)
• Gas cooler status (on / off)
• Carrier gas flow input / output (actual / target)
• Humidity (actual / target)
• Gas pressure (actual / target)
• Status signals (error messages (errors), limit values (limit) and measuring status of the analyser
(Controlstate)
The lower right screen shows the following values of the sensor:
• Selection of the sensor
If several sensors are installed in the analyser, the corresponding sensor must be selected in the
selection window.
• Zero signal