98 User Manual QuickTOC
®
purity
ATEX 2 04E3920
7 How to Work With the Analyser
7.2 Configuration LAR | PROCESS ANALYSERS AG
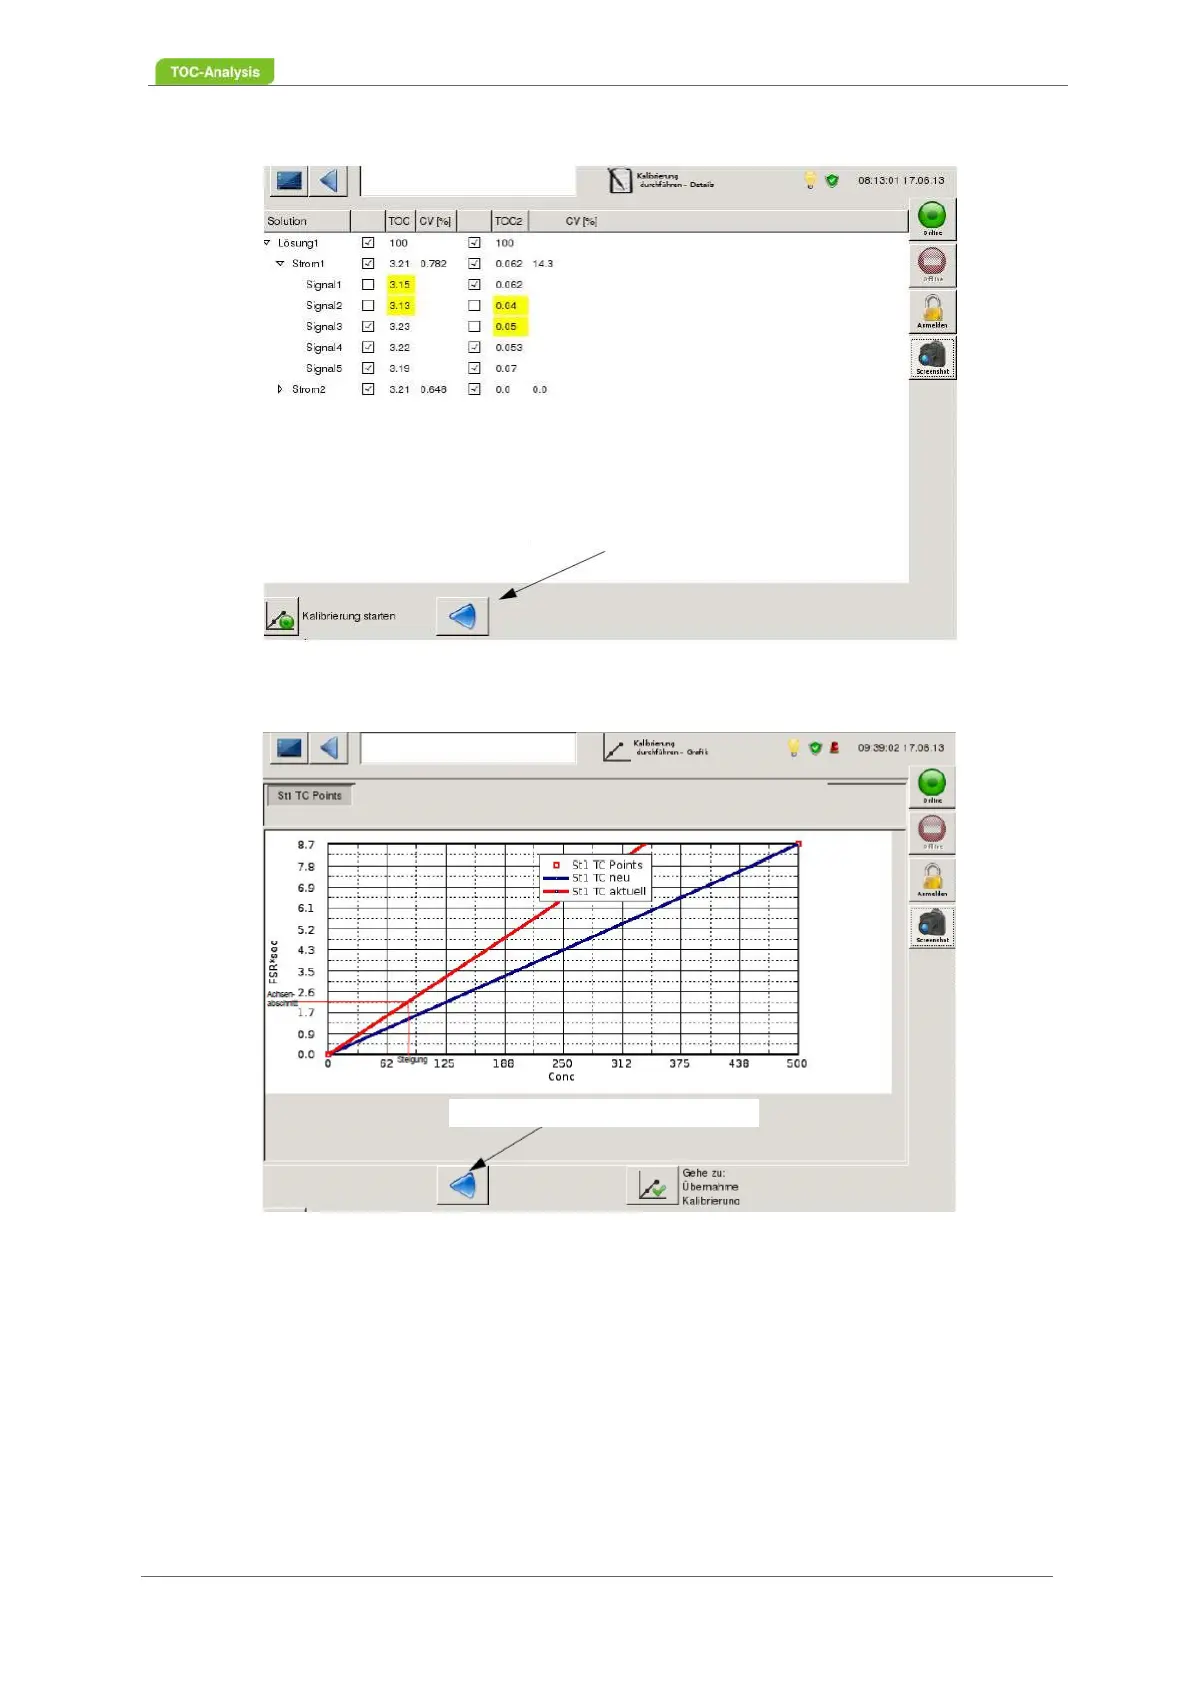
Fig. 59: Calibrate Screen - Show Details (Example)
Fig. 60: Calibrate Screen - Calibration Graph (Example)
7.2.4.2 Calibration Results
After a successful calibration (Chapter 7.2.4.1 from page 95), the results are displayed on the "Calibra-
tion Results" screen (Fig. 61, page 99). To the right, the values of the previous calibration are displayed.
Please activate the calibration via the button "Activate the calibration results". The result is saved. Fur-
thermore, this screen displays the "carrier current setpoint".
Back to Start of Calibration
Back to Start of Calibration