116 User Manual QuickTOC
®
purity
ATEX 2 04E3920
7 How to Work With the Analyser
7.2 Configuration LAR | PROCESS ANALYSERS AG
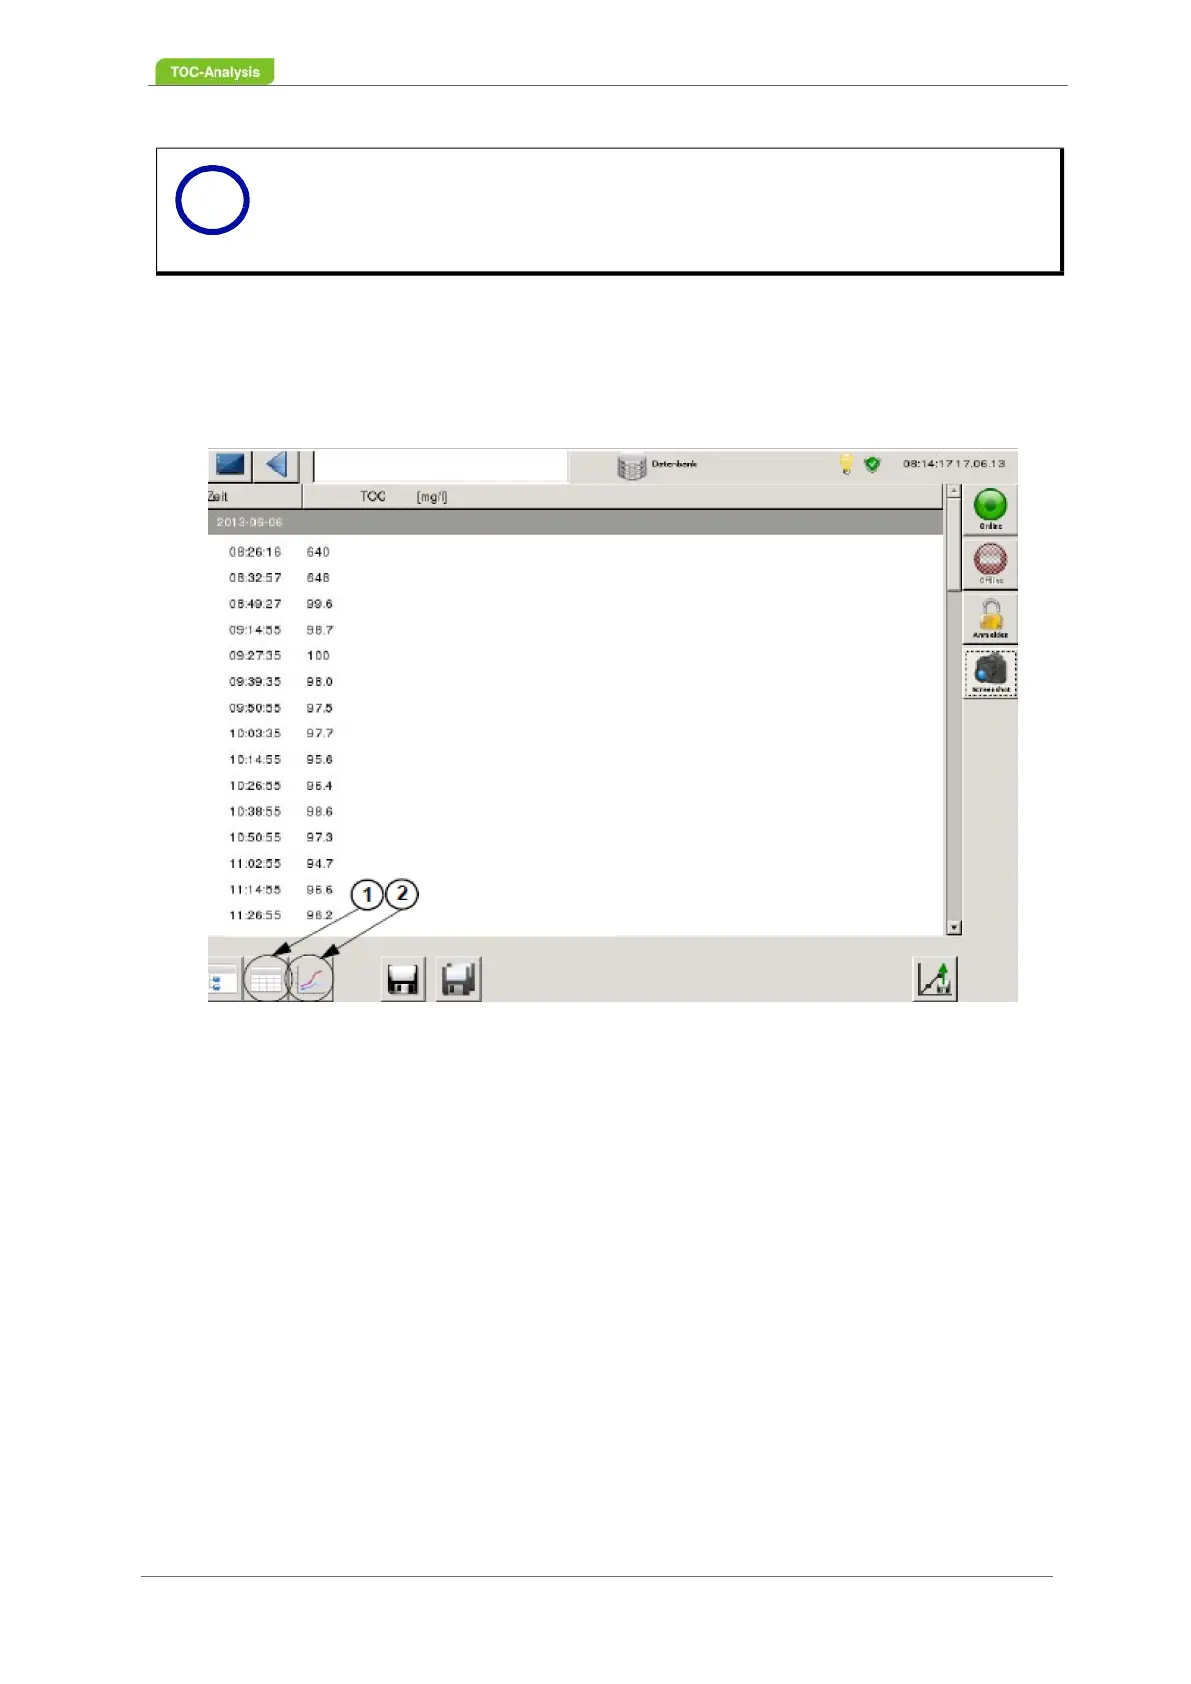
7.2.17.1 Data in Table Form
The measured values are displayed to the right of the timestamp when you press the "Data in table form"
button (1). If the selected measurement data is to be displayed as a curve, the "Measurement history"
button (2) must be activated.
Fig. 78: "Database" screen - table form of the measured data (Example)
7.2.17.2 Daily results as a curve
If the selected measurement data is to be displayed as a graphic in the "Overview database" screen, the
"Measurement data as curve" button must be activated. Each parameter has its own diagram. In order
to change the parameters (e.g. TOC to TC) use the buttons on the top left. From the "Measured data as
table" view (Fig. 77, page 115), you can access the trend view. Click on the button "Daily data history"
(3, Fig. 77, page 115) and the corresponding trace will be displayed.
Notice
The existing data and settings will be overwritten, please contact the technical support
of the LAR (chapter 15.1 from page 203)!
i