04E3920 User Manual QuickTOC
®
purity
ATEX 2 117
7 How to Work With the Analyser
7.2 Configuration
LAR | PROCESS ANALYSERS AG
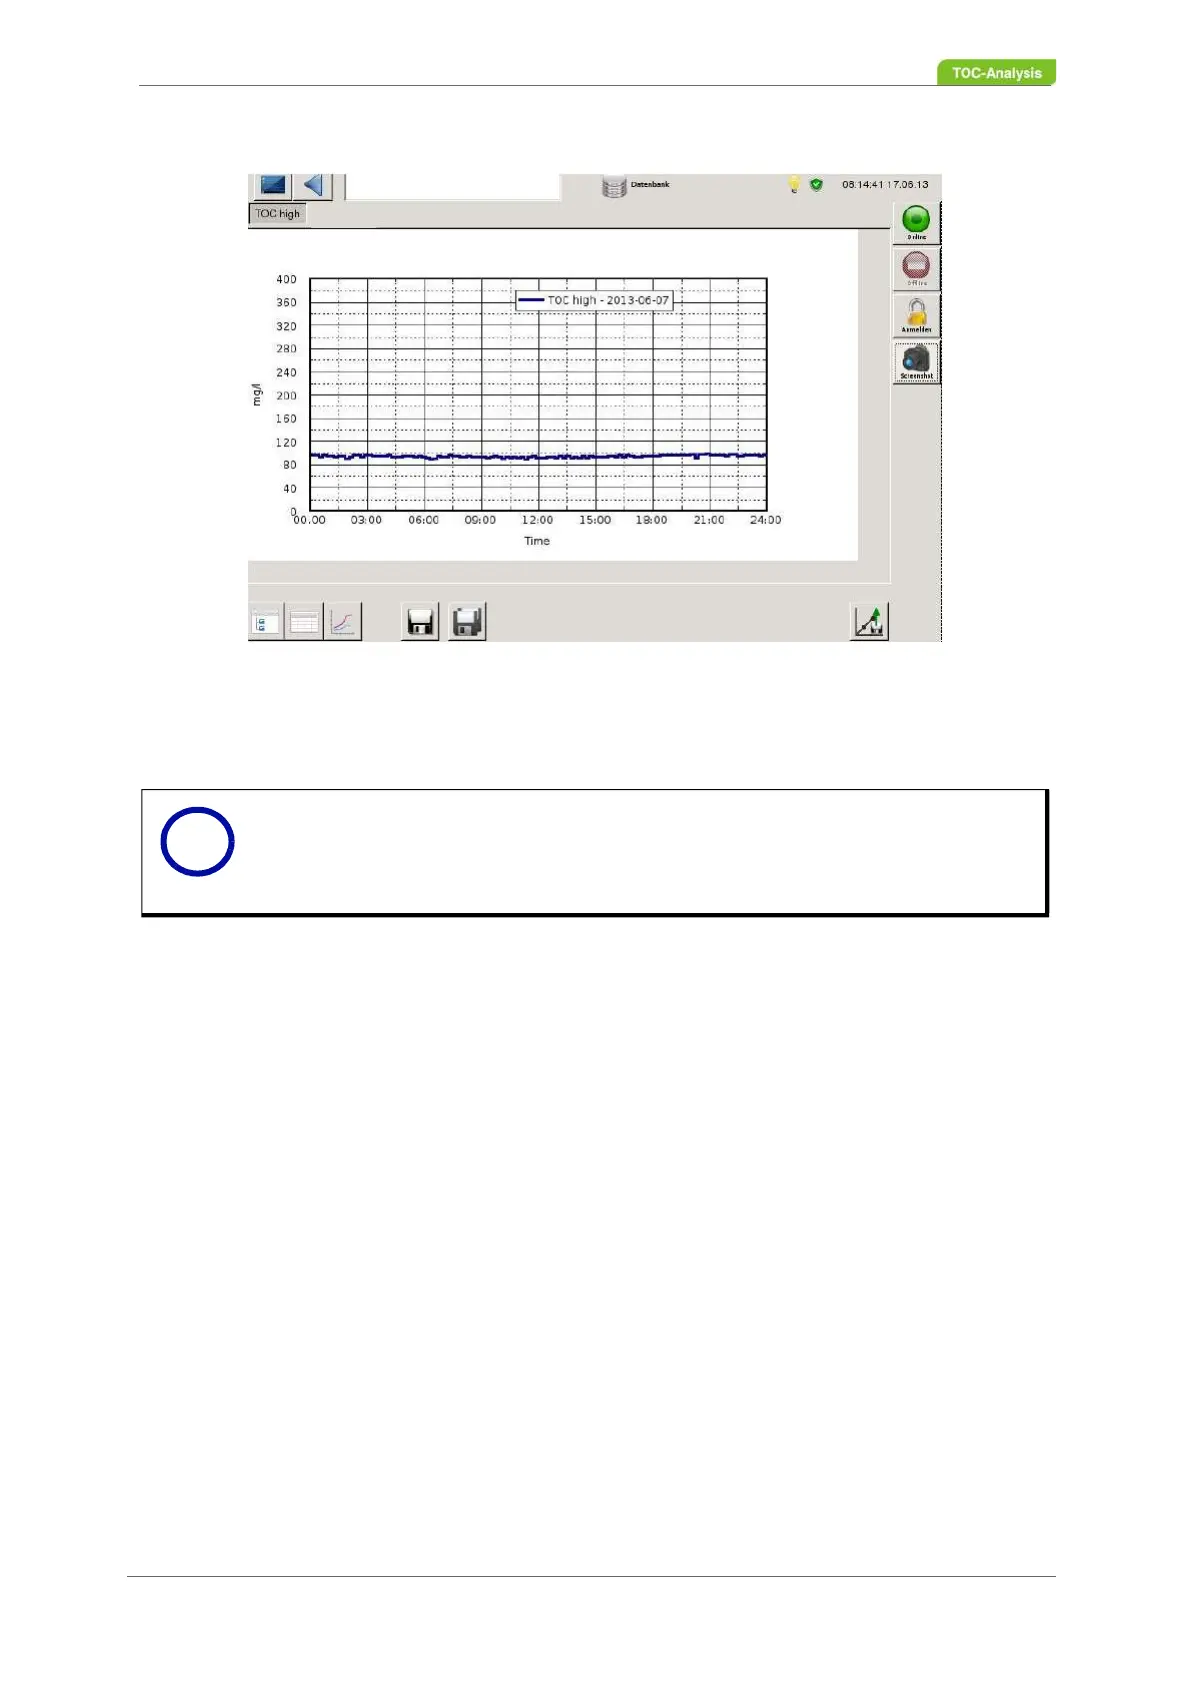
Fig. 79: Database - curve form (Example)
7.2.18 Log
The logbook can be accessed via the status bar.
1. To do this, press the icon "To get to the logbook" (2).
2. A selection window is displayed (Fig. 81, page 118). Select "control state" on this selection window.
3. A new screen is displayed.
There are two views in the logbook:
4. Archiving the logbook
5. Currently applied errors
The logbook insight icon (2) top right consists of three colors:
Green: No fault messages are pending. All necessary conditions for a valid measurement are fulfilled.
The measured value is trustworthy and process-relevant.
Yellow: Fault messages are pending. The measurement could be disturbed and untrustworthy.
Red: Fault messages are pending and the measurement is aborted. The boundary conditions do not al-
low a valid measurement (eg: missing reagents, failed calibration) The device requires immediate main-
tenance.
There are three subfolders in the archiving logbook view:
Error
List of all occurring errors with time of appearance and disappear / reset.
system
The list contains system data of the entire activities of the system (measurement, parameters, self-test,
etc.)
Limits
Notice
The logbook screen is only displayed from user level 2 onwards.
i