04E3920 User Manual QuickTOC
®
purity
ATEX 2 97
7 How to Work With the Analyser
7.2 Configuration
LAR | PROCESS ANALYSERS AG
previous graph.
11. In the Calibration Results screen, the calibration results (slope and intercept) can be viewed and
activated.
7.2.4.1.2 Perform a multipoint calibration (three solutions) for a sample stream
1. Preparation of the calibration solutions and positioning of the first calibration vessel.
2. In the selection box "Calibration solutions" the number of calibration solutions can be selected.
3. After selecting the number of solutions, this amount will be displayed on the screen. The maximum
CV can be entered in% for the calibration.
4. Between solution and power there are input fields for the concentration of the solution. Enter all
ingredients of the solutions in the table: Double-click in the input field. A number pad and keyboard
will appear. Please enter the concentration (ppm).
5. To accept the new calibration concentration, save it with the floppy disk symbol (Fig. 57, page 96).
6. Select the check box for the sample stream and all solutions. Now the calibration can be started
with the button "Start calibration".
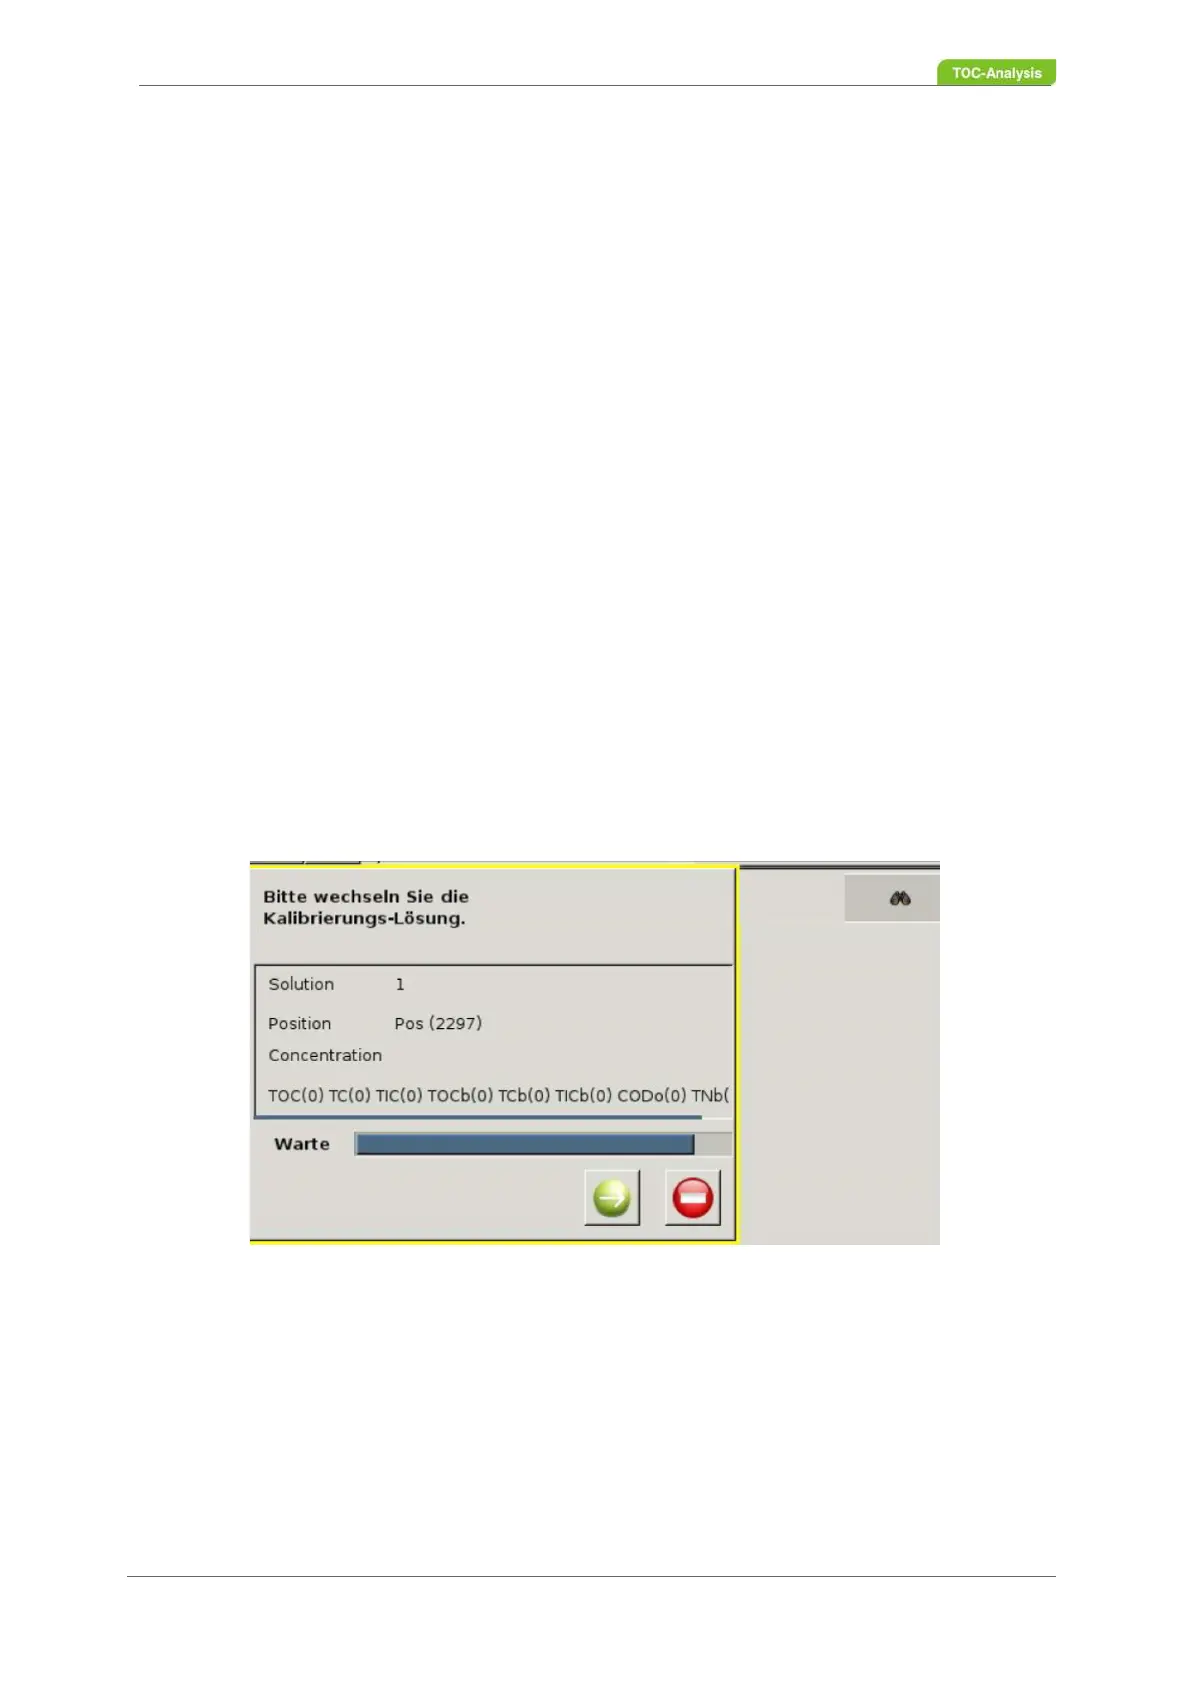
7. After passing through the first solution (5 measurements), a message appears (Fig. 54, page 101).
Here, the green arrow must be pressed when the next calibration solution has been placed to
measure the next solution. This stop message will be displayed twice until all three solutions have
been measured.
8. After passing through the three calibration solutions, the raw values can be viewed in the next
screen with the "Show Details" button. All check boxes in the "Show Details" screen are enabled
for the solutions and the power being performed. Outliers are detected by the software and marked
in yellow. These outliers are not included in the calculation.
9. Afterwards, the new calibration graph can be viewed in the "Show graph" screen with the previous
graph.
10. In the screen "Calibration results", the calibration results (slope and intercept) can be viewed (see
chapter 7.2.4.1 from page 99) and activated.
Fig. 58: Stop message for further calibration solutions (Example)