LDI Intellectual Property.
Not for secondary distribution or replication, in part or entirety.
DIGISONDE-4D
SYSTEM MANUAL
VERSION 1.2.11
SECTION 3 - OPERATING INSTRUCTIONS 3-19
of MUF frequencies calculated for pre-configured path distances. All three types of the output files can be se-
lected for local storage on the Digisonde
®
’s hard disk, archival on removable media (CD, DVD), as well as
scheduled for delivery to remote servers via FTP or SFTP protocols, as further explained below in Chapter 4.
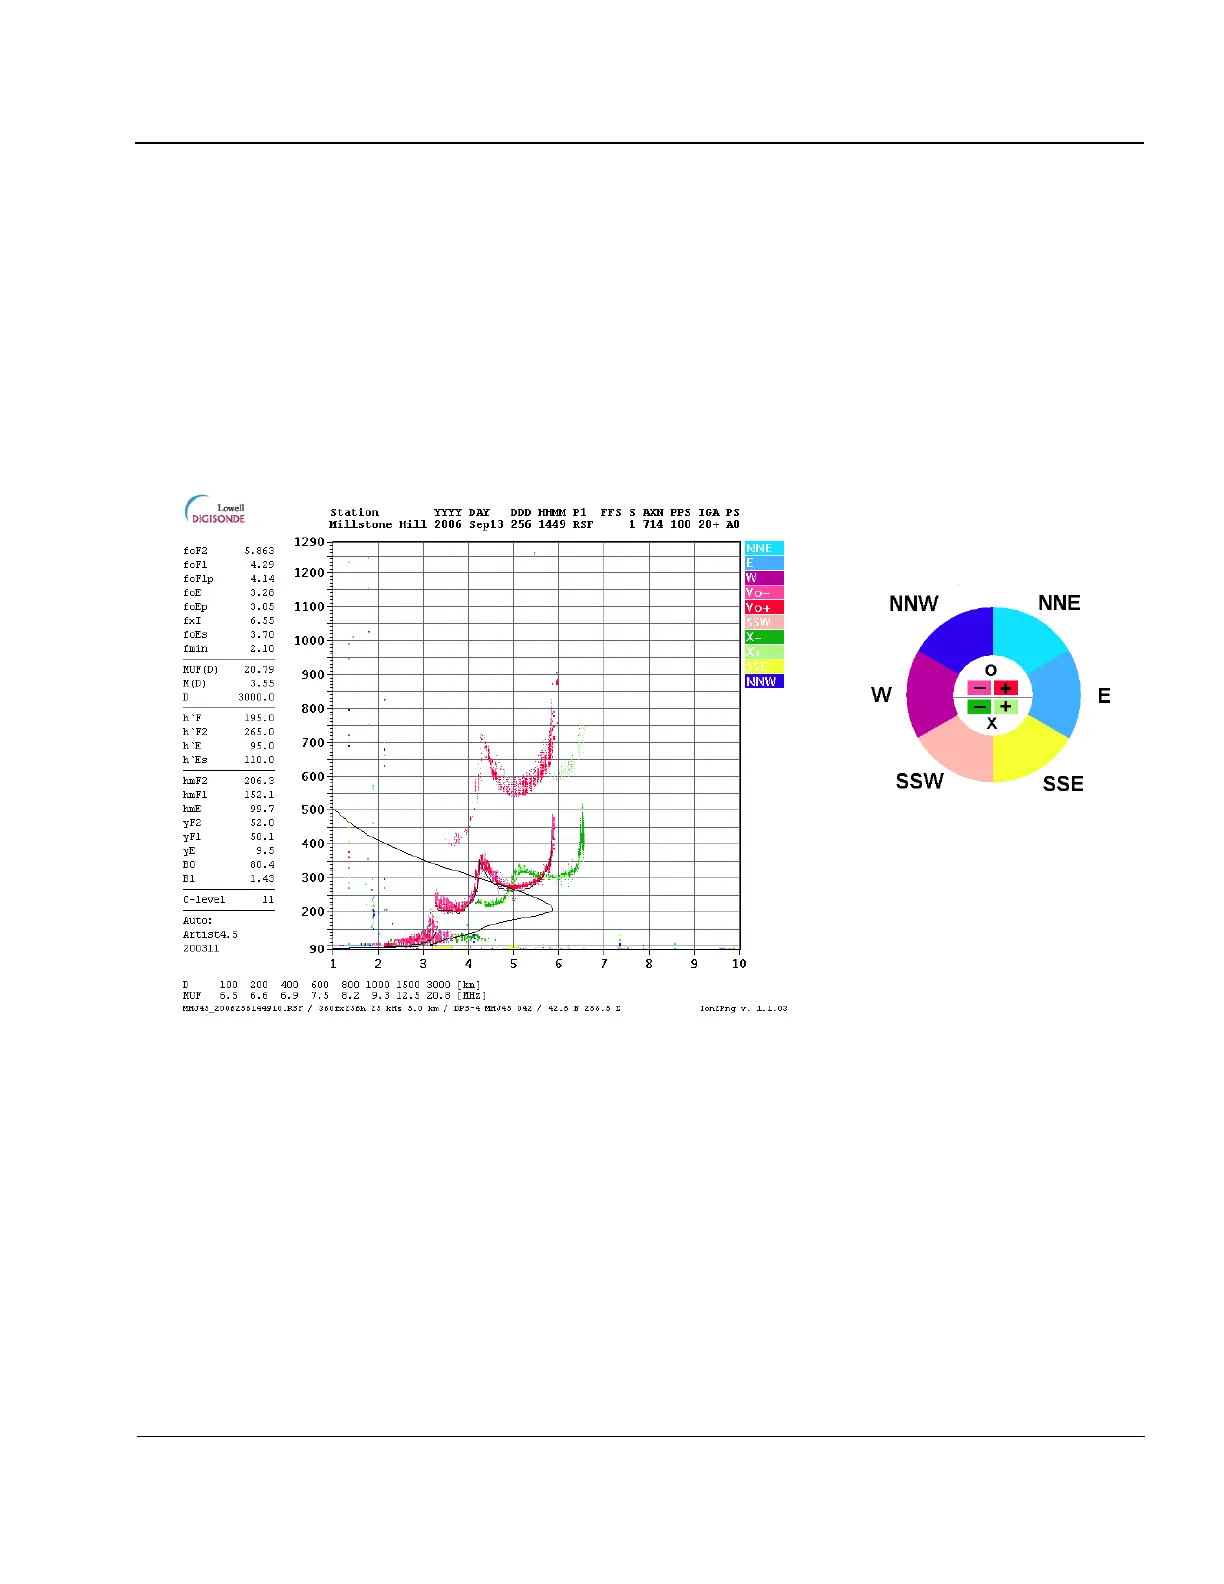
3:32. Figure 3-11 shows an example of ionogram picture prepared by Ion2PNG utility for the Digisonde
®
webpage, in which the raw ionogram data are combined with the ARTIST-derived ionospheric characteristics,
NHPC-calculated profile of the electron density plasma, and table of the maximum usable frequencies (MUF)
obtained for a pre-specified list of distances. The table of autoscaled characteristics include confidence level of
the autoscaling ranging from 55 (low confidence) to 11 (high confidence), as well as the version of the ARTIST
software used to obtain the scaled data.
Color legend:
Red shades = O-polarization, vertical
Green shades = X-polarization, vertical
Blue (cold) shades for North/East
Yellow(warm) shades for South/West
Figure 3-11: Ionogram Display Produced by Ion2PNG Software for Digisonde
®
WWW Homepage
Presentation of Directional Ionogram Data as Daily Directogram
3:33. The directogram display is useful to view large-scale plasma irregularities as they drift across the
Digisonde
®
location. It uses RSF ionogram data to derive ground distances to the plasma structures responsible
for the oblique echoes in the ionograms and then to plot them using direction, Doppler, and amplitude infor-
mation of the echoes. The left panel of Figure 3-12 presents an example of the directogram plotted by
Drg2PNG software using one day of RSF ionograms collected at Jicamarca, Peru. Each horizontal line of the
directogram represents one ionogram measurement, with time going downwards. There are two vertical panels,
with the left panel corresponding to echoes arriving from west, northwest and southwest, and right panel for
echoes from east, northeast and southeast. The central line between the panels corresponds to the vertical re-
flection at zero zenith angle. The directogram on Figure 3-12 does not show much activity between 10:00 and


 To Next Page