LDI Intellectual Property.
Not for secondary distribution or replication, in part or entirety.
DIGISONDE-4D
SYSTEM MANUAL
VERSION 1.2.11
SECTION 3 - OPERATING INSTRUCTIONS 3-51
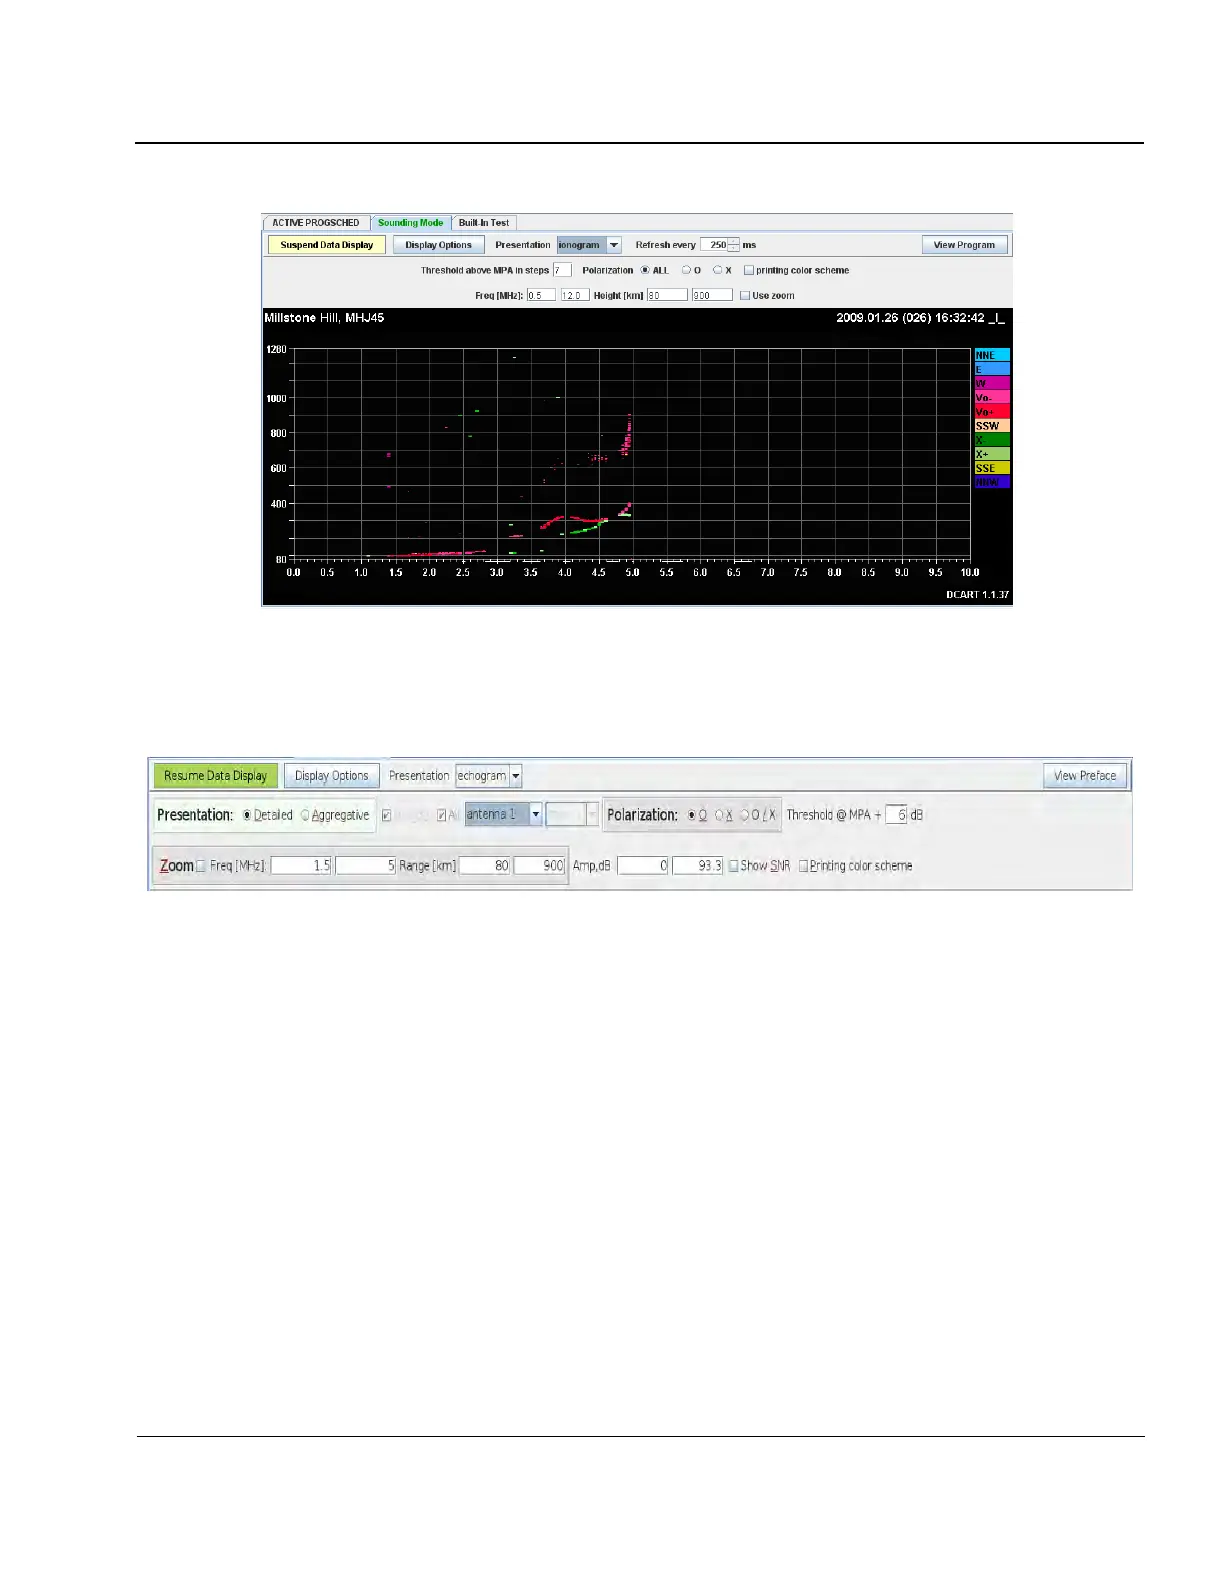
Figure 3-38: Real-Time Display of Ionogram Measurement in Progress (Ionogram Presentation)
Ionogram measurement can be additionally presented as an echogram, which when selected makes available
several additional display types. Once the echogram has been selected, two additional presentation modes are
made available “Detailed”, and “Aggregative.” The echogram display controls are shown in Figure 39
Figure 39: Echogram presentation display controls
Detailed echogram presentation display
3:90. When “Detailed” presentation is selected from within the echogram display window data is displayed
as frequency and height, andcolor is used to represent signal amplitude (see Figure 3-40) instead of polariza-
tion and direction as in the traditional ionogram. In addition to the common options for the ionogram visualiza-
tion, the echogram display allows selecting individual antennas, and assigning different maximum amplitude
value to the color legend. When selecting “O/X” within the Polarization block the display switches back to a
simplified version of the standard ionogram display where color represents polarization.