LDI Intellectual Property.
Not for secondary distribution or replication, in part or entirety.
DIGISONDE-4D
SYSTEM MANUAL
VERSION 1.2.11
SECTION 5 - SYSTEM SOFTWARE 5-25
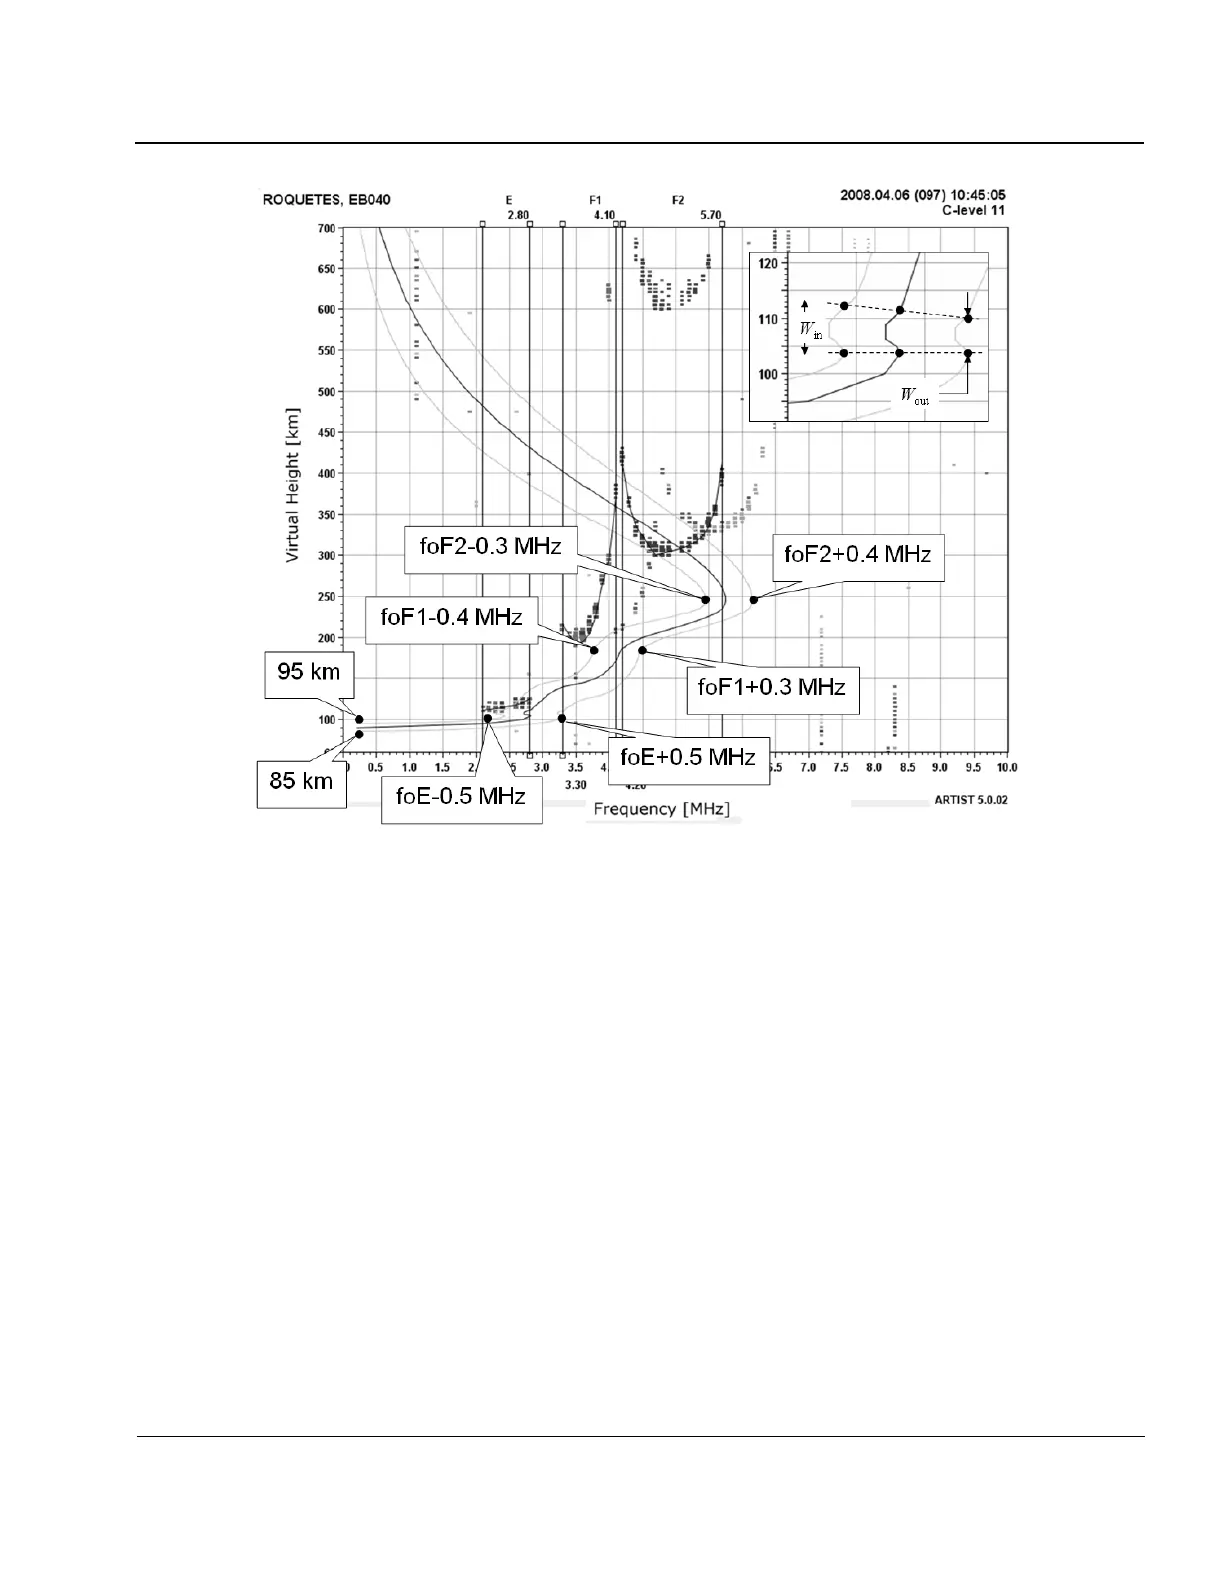
Figure 5-8: Autoscaled Ionogram from Roquetes, Spain, with Inner and
Outer Error Boundaries for Calculated EDP.
The Error Boundaries are Obtained by Modifying the Original Profile Coefficients so that the Boundary
Fits the Anchor Points as Indicated. Error Bars for foE, foF1. and foF2 Critical Frequencies are Specific
to the Quiet Confident Ionograms at Roquetes (95% Probability Level).
Processing Precise Ranging Data in ARTIST
5:51. The ARTIST-5 software takes advantage of the PR processing in the ionograms that were taken in the
PR mode by a technique that verifies consistency of the precise range measurements and interpolates missing
values. The technique is illustrated in Figure 5-9 where the ARTIST trace extracted without PR information is
shown as the yellow line along the leading edge of the echo trace, and the white line corresponds to the updated
h’-trace in which all range values are corrected using available PR data. The PR value calculated for each echo
bin is shown as a white number within the bin giving the accurate h’ for this echo. The star symbols indicate PR
values that passed consistency criterion and were directly used to update the initial trace derived exclusively
from the amplitude information. Diamond shapes show PR values that are inconsistent over the pulse width
interval, for which the trace point is adjusted using an average bias of the range evaluated from all consistent
PR values. Finally, circle shapes are used to show interpolated trace gaps that are re-interpolated using new
trace values.