LDI Intellectual Property.
Not for secondary distribution or replication, in part or entirety.
DIGISONDE-4D
SYSTEM MANUAL
VERSION 1.2.11
SECTION 3 - OPERATING INSTRUCTIONS 3-47
Real-time Display of Doppler Spectra (Step 5 of Processing Chain)
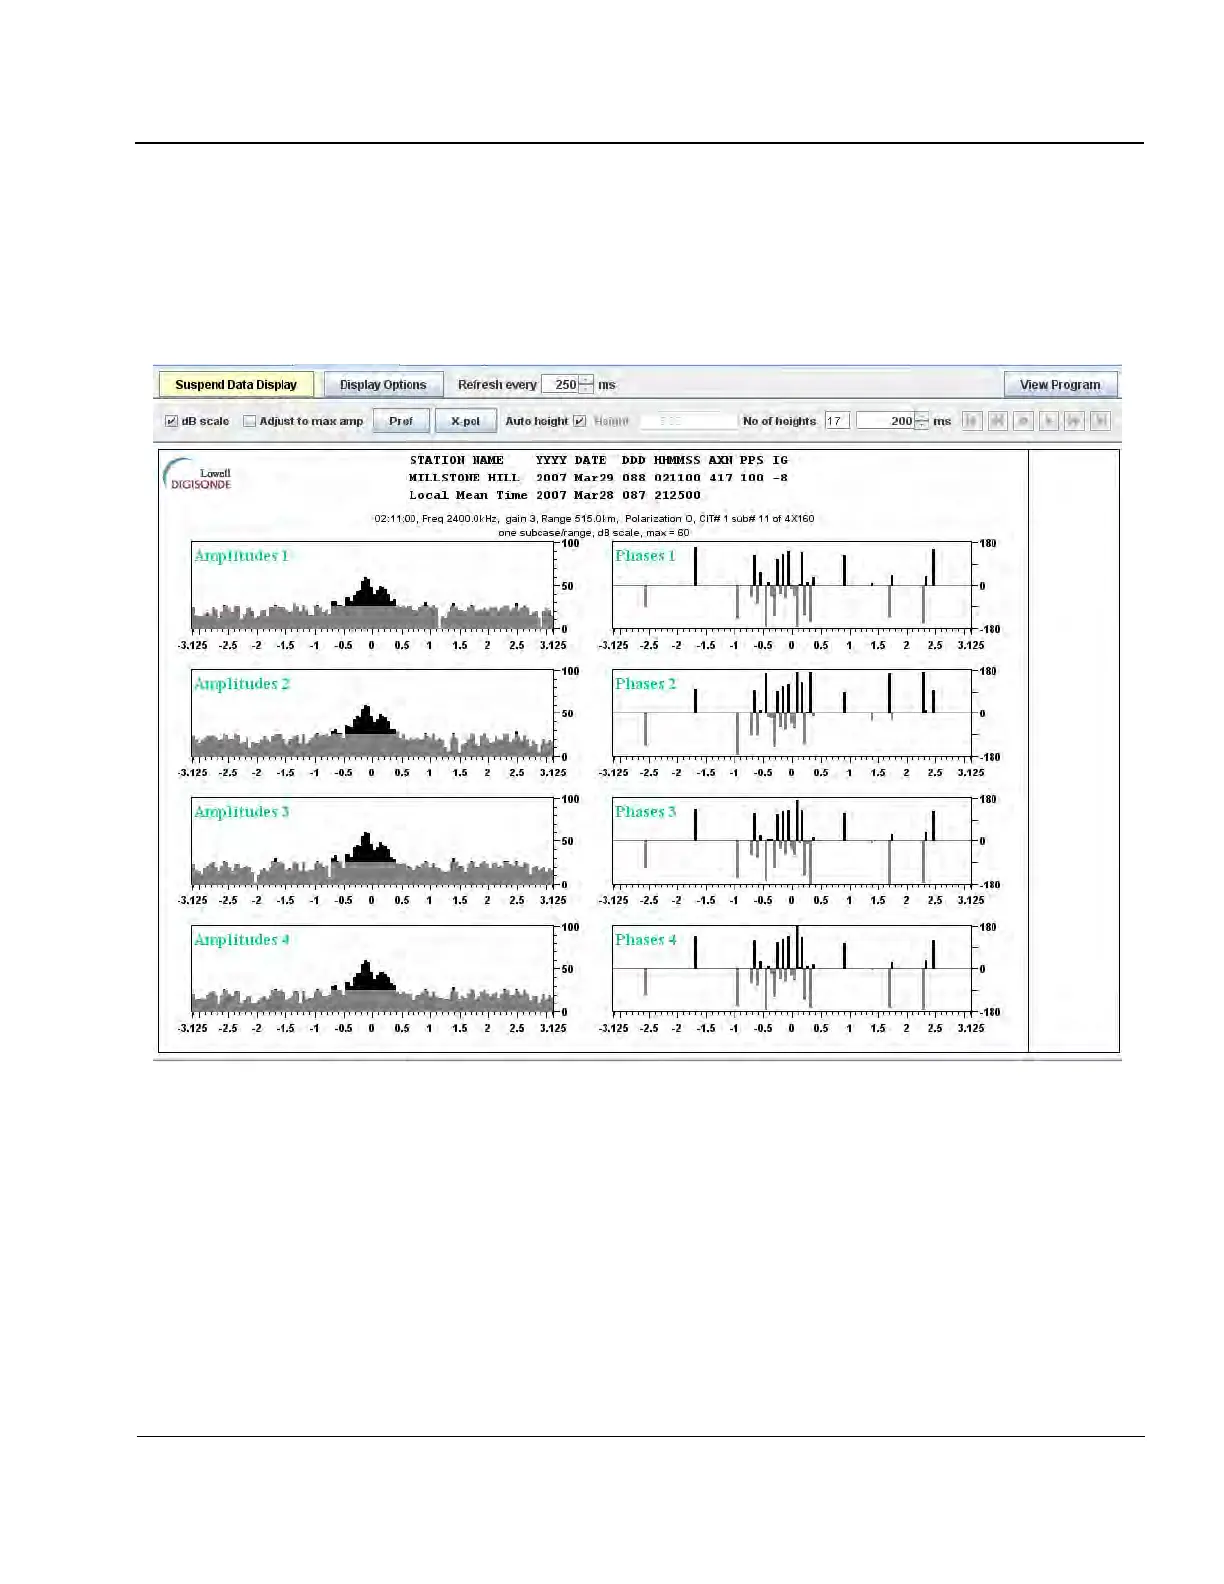
3:86. Figure 3-35 shows real-time “single range” Doppler Spectra display, in which FFT is taken over sorted
samples belonging to the same range bin across pulse repetitions. The plot shows four channels of data with the
magnitude of signal in the left column and phase in the right column. Note that abscissa of the plots uses Dop-
pler Frequency in Hz. Available screen controls for data visualization are shown in Table 3-4.
Figure 3-35: Real-time “Sounding Mode” Display, Doppler Spectra Plot
(Step 5 of the Processing Chain)