LDI Intellectual Property.
Not for secondary distribution or replication, in part or entirety.
DIGISONDE-4D
SYSTEM MANUAL
VERSION 1.2.11
3-20 SECTION 3 - OPERATING INSTRUCTIONS
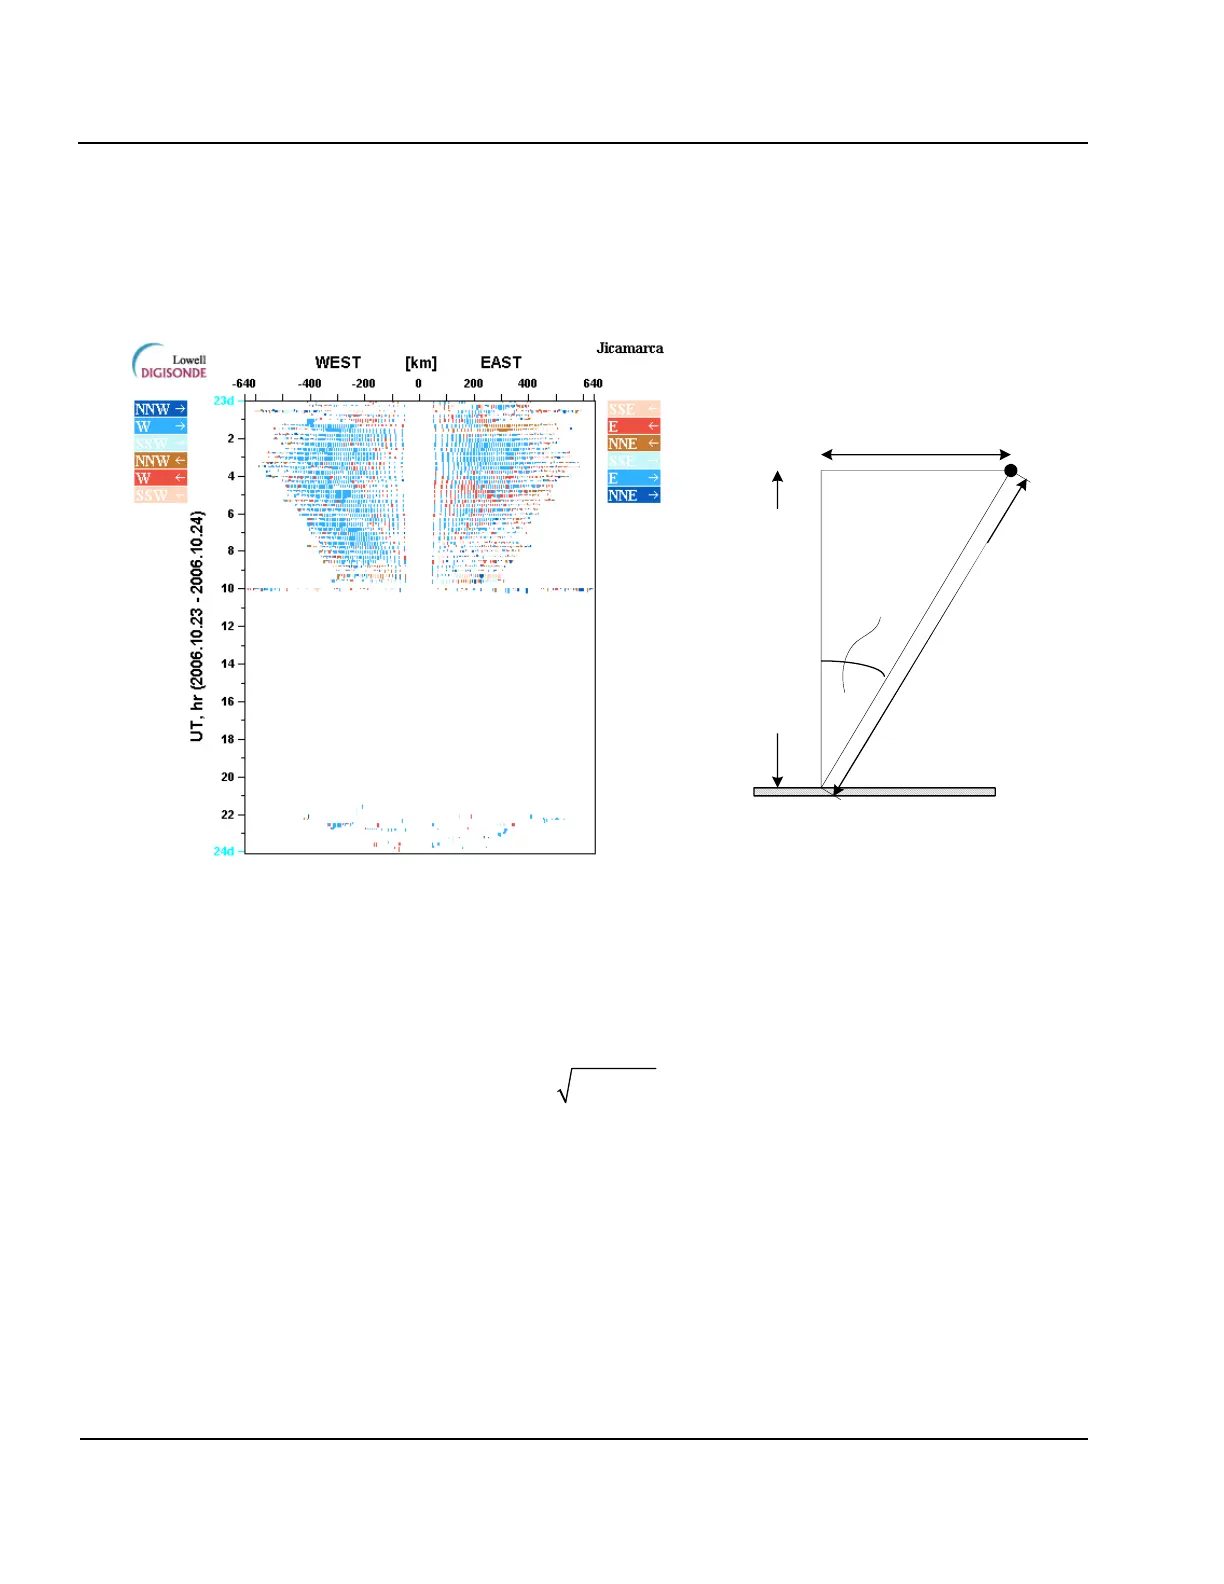
24:00 UT, at which time passing day-night terminator causes generation of several ionospheric disturbances
traveling east. Shades of blue in the directogram correspond to general direction of plasma drift from west to
east, and shades of red are used to represent drift in the opposite direction from east to west.
H
v
= representative
height of the layer
H
i
= oblique echo range
D
i
= distance to
reflection point
i
= beam
angle
Figure 3-12: Daily Directogram. (Left panel) Sample Directogram made by Drg2PNG Software,
(Right Panel) Calculation of Distance to the Reflection Point, D
i
3:34. The right panel of Figure 3-12 illustrates calculation of the ground distance to the reflection point that
is plotted along the x axis on directograms. Ground distance to the reflection point, D
i
, is calculated individual-
ly for each oblique echo range H
i
corresponding to a plasma structure:
where H
v
is a representative vertical height of the F layer that is estimated from the ionogram by locating the
section of the vertical incidence F trace where amplitudes are high and height gradient is low. When manually
scaled trace is available, hminF can be used reliably as H
v
. For the autoscaled data, more consistent results are
obtained by calculating summary amplitudes for each ionogram height and selecting H
v
as the height of the
highest summary amplitude.
Programming Oblique Incidence Ionogram Measurement
3:35. Digisonde-4D can be configured to receive signals from other Digisonde
®
systems in the area, in which
case transmitted signals arrive via oblique propagation mode (Figure 3-13). Both the transmitting and the re-
ceiving Digisonde
®
must be synchronized to UT time using their GPS receivers so as to start and progress the
oblique incidence (OI) measurement in precise synchronization. In order for the Digisonde-4D to transmit or


 To Next Page