LDI Intellectual Property.
Not for secondary distribution or replication, in part or entirety.
DIGISONDE-4D
SYSTEM MANUAL
VERSION 1.2.11
1-32 SECTION 1 - GENERAL SYSTEM DESCRIPTION
terferers poses a significant challenge. Such interferers are typically signals from other transmitters, in many
cases broadcasting stations, with unpredictable occurrences at a priori unknown frequencies.
1:68. To largely suppress these narrow-band interferers we implemented the digital RFIM technique, which
is based on a patented technique developed by Bibl [2005]. This technique determines (a) the exact frequency
with sub-frequency spectral resolution of the largest contributor to the spectrum of the input signal, (b) ampli-
tude and phase of the found contributor by using a single-line spectral analysis of the input signal at the deter-
mined frequency, and then (c) subtracts the interferer signal from the input signal in the time domain, and (d)
repeats the algorithm for the next biggest interferer, etc.
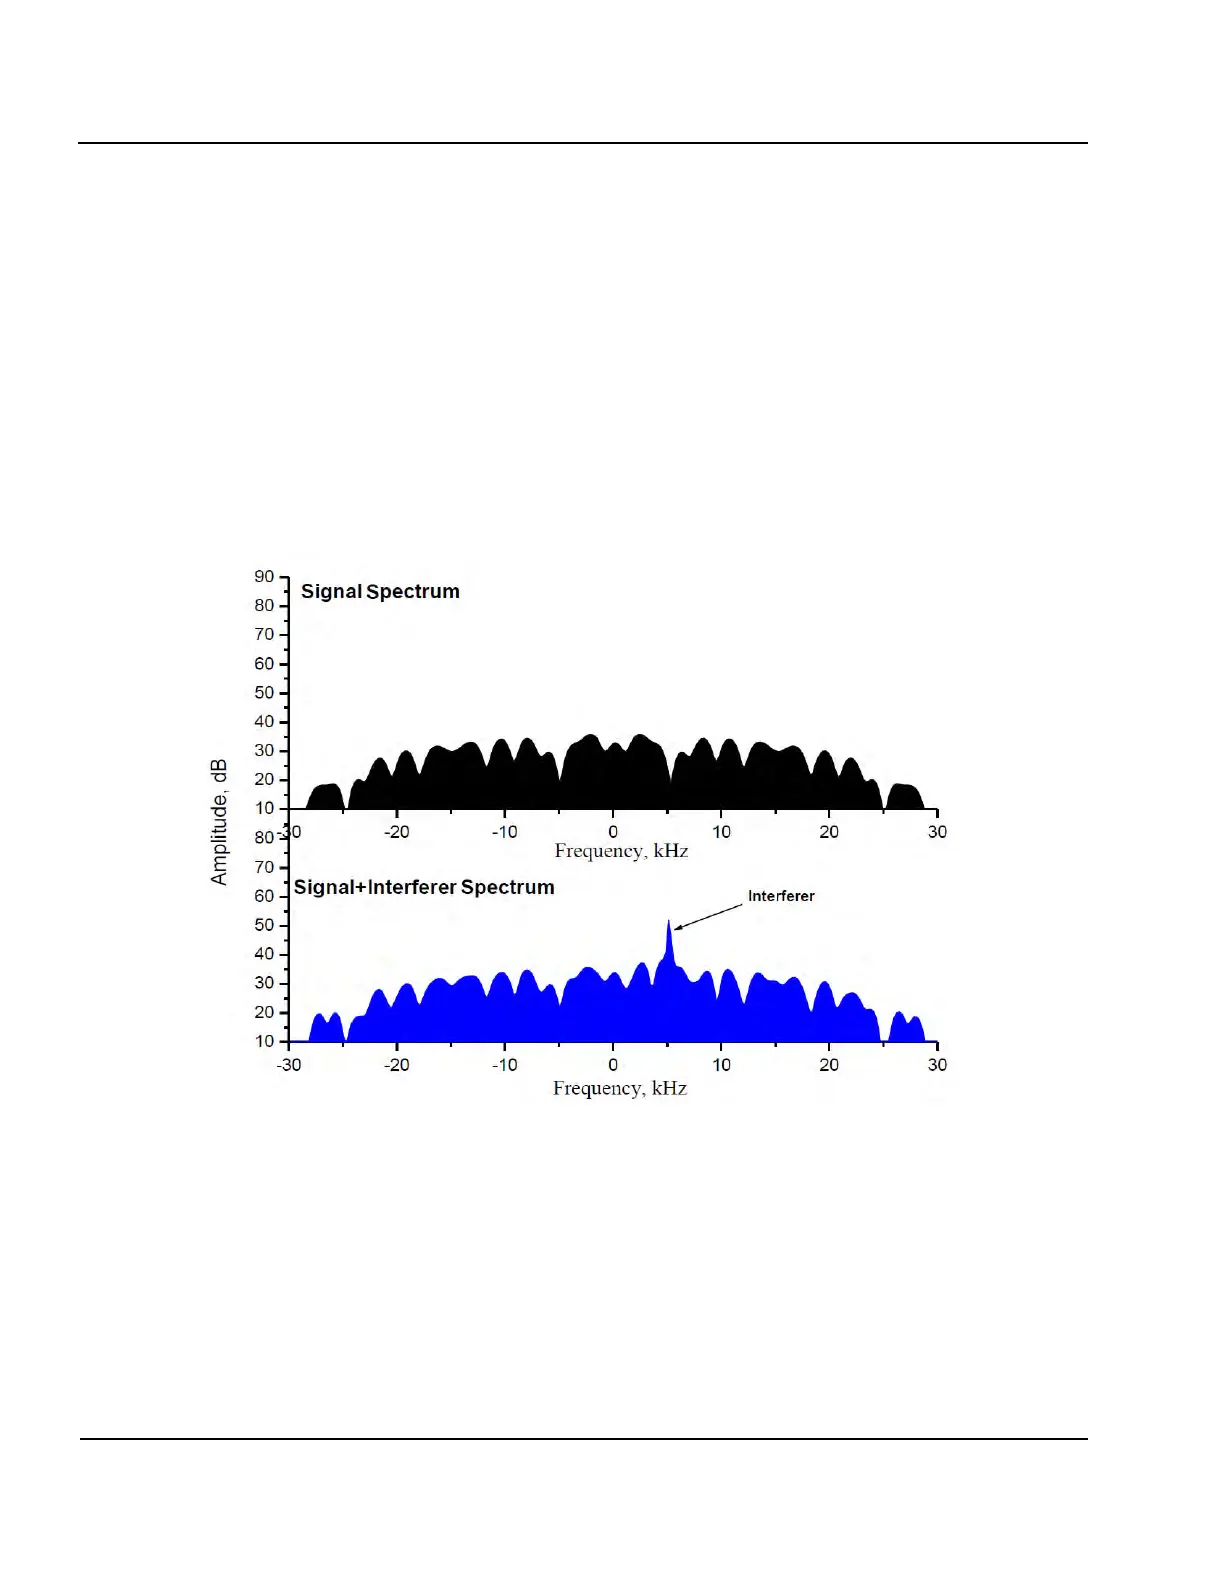
1:69. Figure 1-19 illustrates the RFIM performance in a lab test configuration with a coherent interference
signal infused at 20 dB above the loopback test signal. The upper panel in Figure 1-19 displays the Fourier
spectrum of the Digisonde
®
signal (16-chip phase-coded pulse). The lower panel shows the spectrum of the
same signal with the added interferer appearing as a spike near 16 kHz.
Figure 1-19: Spectrum of the Received Signal Without Interferer (Top) and With Interferer (Bottom).
1:70. The objective of the RFI mitigation algorithm is to remove the interferer signal before any further sig-
nal processing is done. To subtract this interference signal from the input signal requires knowledge of its exact
frequency, phase, and amplitude. Figure 1-20 shows the spectrum of a truncated monochromatic wave. The
width of the main spectral peak is inversely proportional to the length of the time period over which the spec-
trum is calculated.