LDI Intellectual Property.
Not for secondary distribution or replication, in part or entirety.
DIGISONDE-4D
SYSTEM MANUAL
VERSION 1.2.11
SECTION 5 - SYSTEM SOFTWARE 5-23
bars. No visible difference was found in the accuracies calculated for different time periods of the day and sea-
sons.
Error Bars for Autoscaled Critical Frequencies
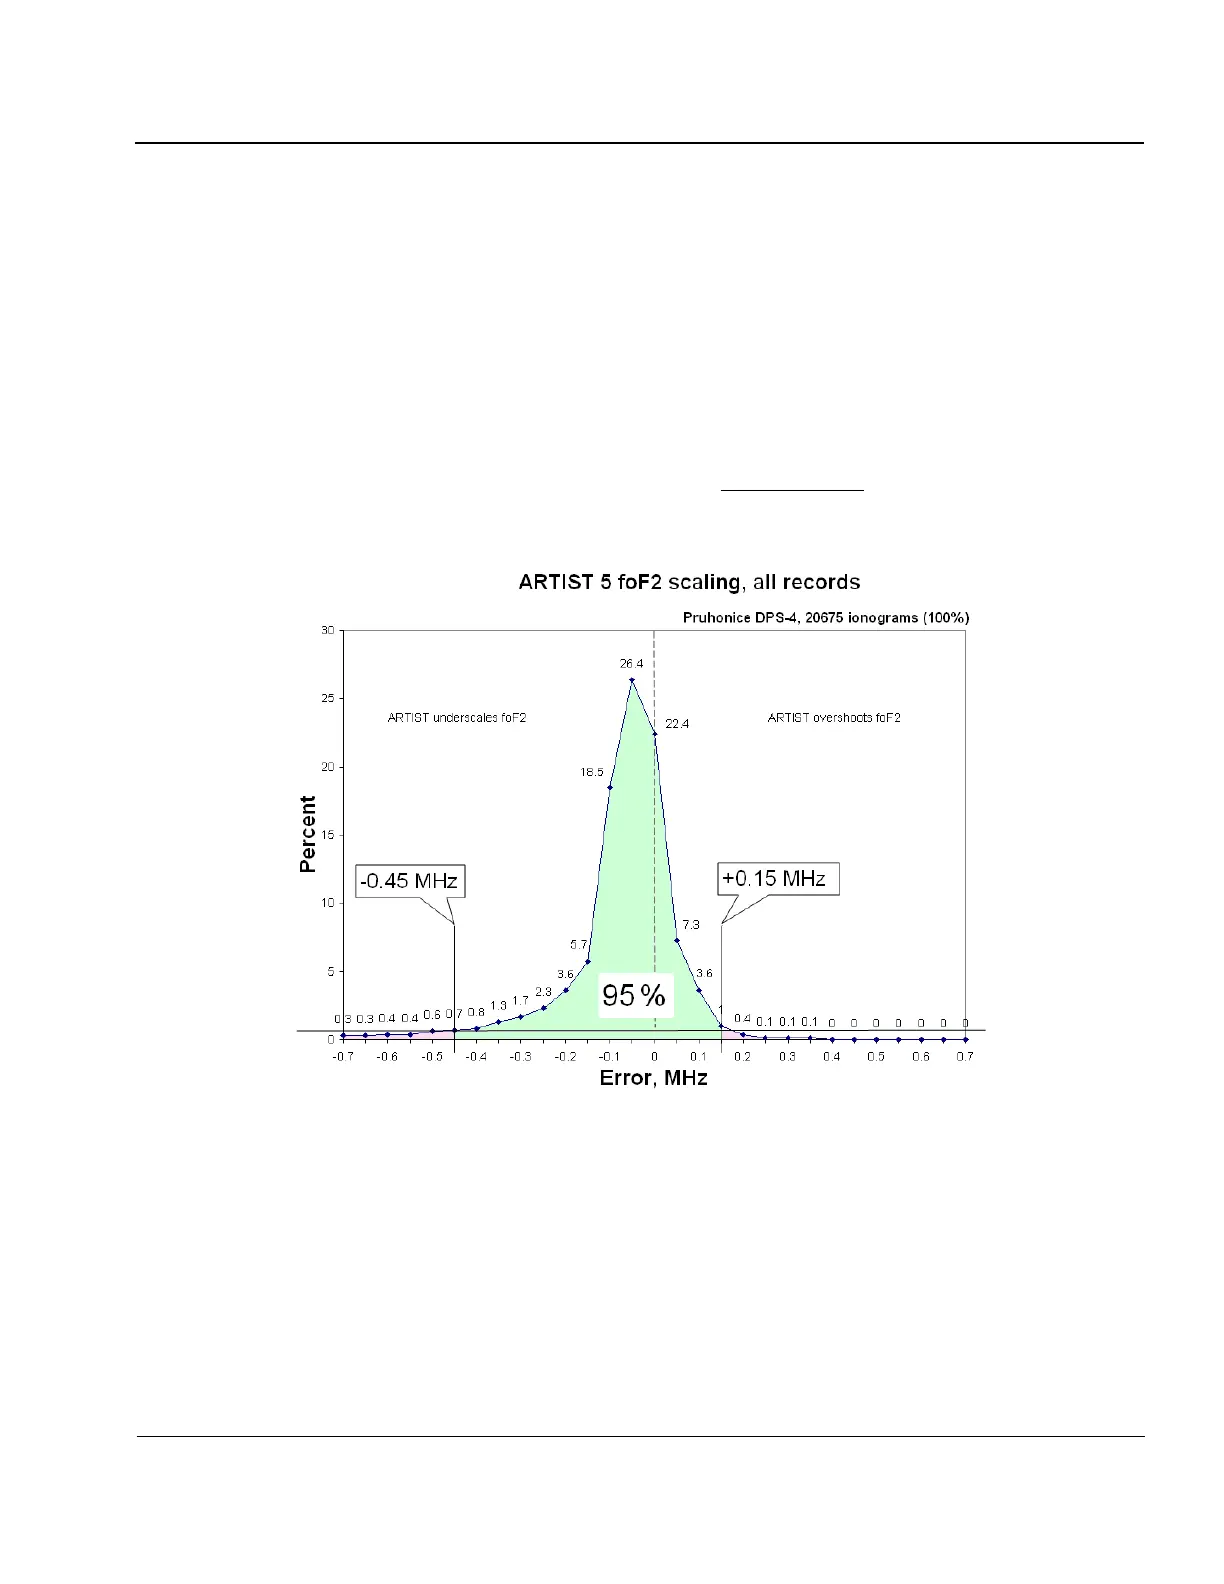
5:47. Figure 5-6 illustrates the approach taken for evaluation of the error bars for the critical frequencies. It
shows an example error histogram for the critical frequency of the F2 layer, foF2, obtained for 20,675 manually
scaled Průhonice DPS4 ionograms. The error histogram plots the percent of records as a function of observed
error, i.e. the difference between manual and ARTIST values. A negative error means that the autoscaled value
is underestimated, and a positive error corresponds to ARTIST overshooting the true foF2.
5:48. Using the histogram data, we select the percent level (horizontal line in Figure 5-6) so that 95% of all
ionograms are contained above it. Corresponding intersections of the 95% percent line with the histogram curve
then serve as the lower and upper uncertainty bounds that secure 95% probability for the true value to fall with-
in provided bounds. For the Průhonice DPS4, such intersection points are -0.45 and +0.15 MHz, so that future
autoscaled foF2 values can then be reported with uncertainty bounds of -0.15 to +0.45 MHz.
Figure 5-6: Error Histogram of Autoscaled Critical Frequencies of F2 Layer
Obtained for 20675 Ionograms from DPS4 Ionosonde at Průhonice, Czech Republic
(95% of all autoscaled values lie within the -0.45 to +0.15 MHz interval from
the true values provided by manual scalers.)