LDI Intellectual Property.
Not for secondary distribution or replication, in part or entirety.
DIGISONDE-4D
SYSTEM MANUAL
VERSION 1.2.11
3-52 SECTION 3 - OPERATING INSTRUCTIONS
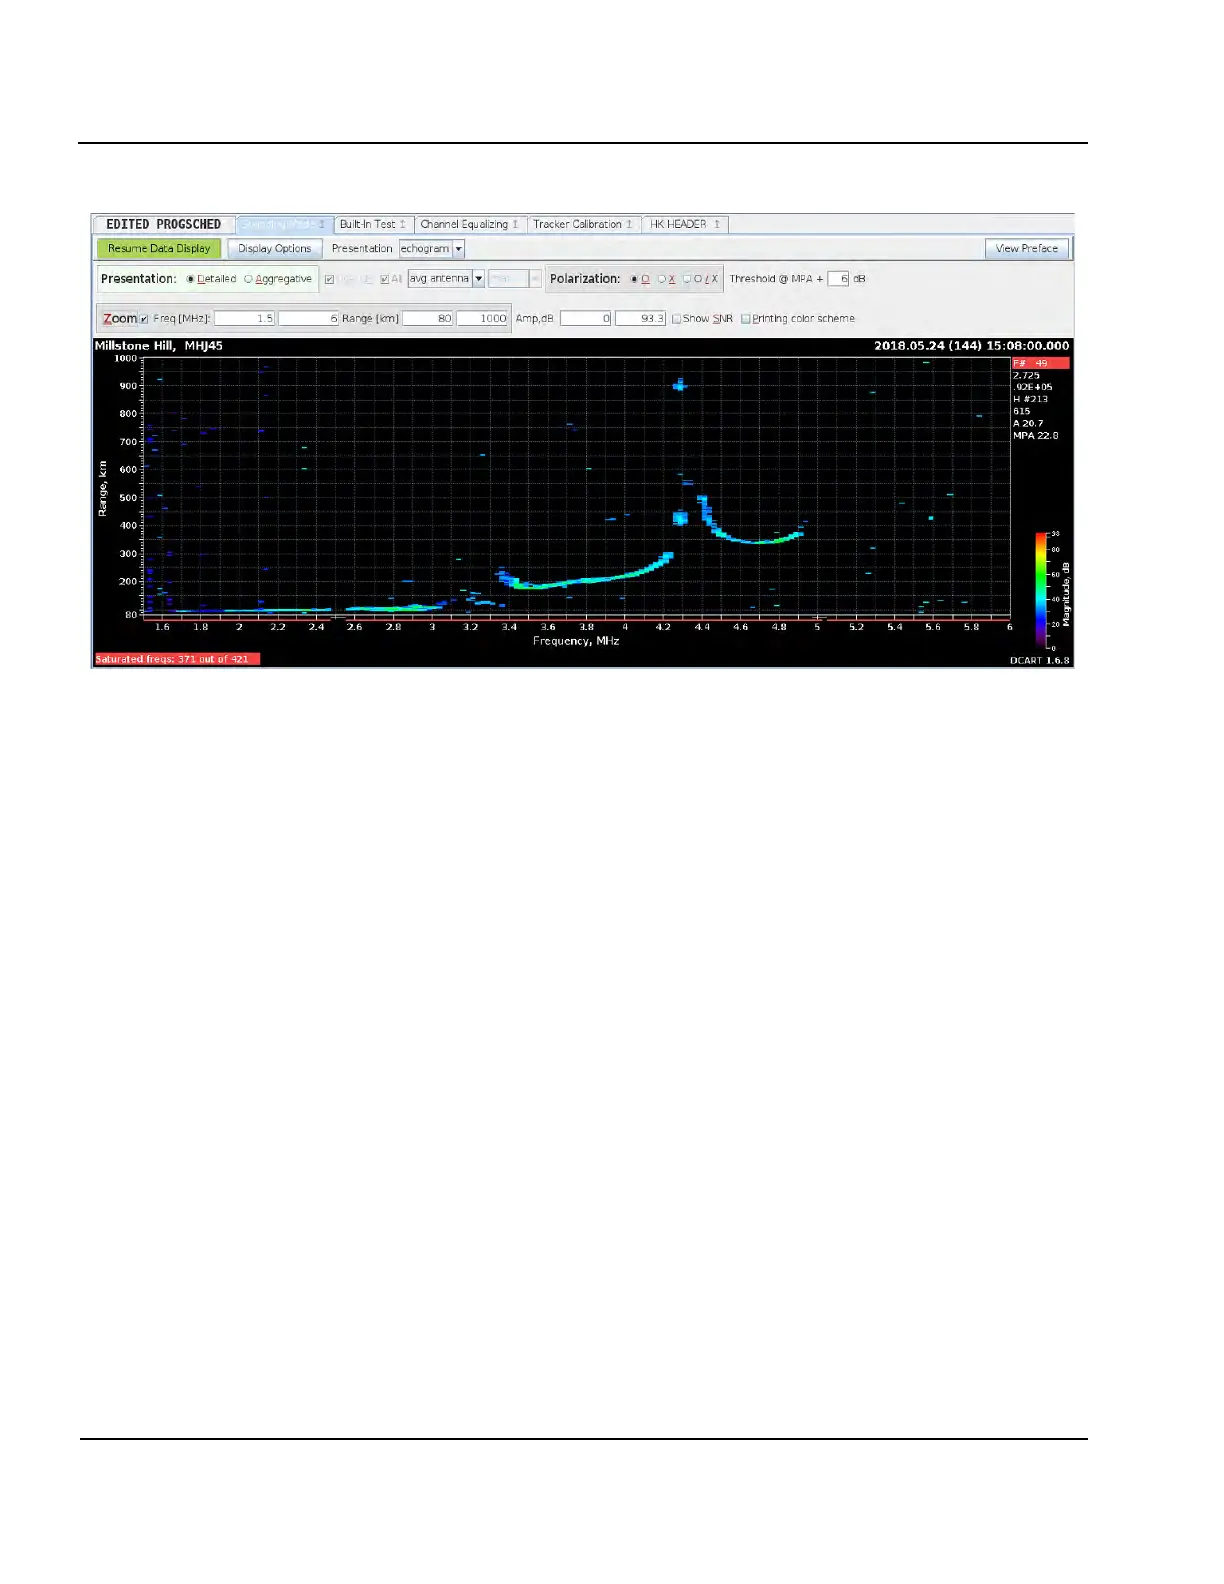
Figure 3-40: Real-Time Display of Ionogram Measurement in Progress (Echogram Presentation)
Aggregative echogram presentation display
3:91. When “Aggregative” presentation is selected from within the echogram display controls the display
presents the ionogram data in the frequency surveillance style as shown in Figure 3-41. It is possible to select
maximum, minimum, median, or spectral maximum amplitude out of all available data per frequency for plot-
ting on the spectrogram. In addition to the frequency surveillance at the sounder location, spectrogram presen-
tation can be useful for tracker calibration, evaluation of the receiver transfer function, and monitoring of the
system noise floor.