LDI Intellectual Property.
Not for secondary distribution or replication, in part or entirety.
DIGISONDE-4D
SYSTEM MANUAL
VERSION 1.2.11
1-30 SECTION 1 - GENERAL SYSTEM DESCRIPTION
be sent. However, in both cases, after each pulse compression, one complex amplitude synthesized pulse, r
2
(n)
in Equation 1-10 which is equivalent to a 67 sec rectangular pulse exists which can be placed into the coher-
ent buffer.
1:62. The full buffers now contain a record of the complex amplitude received from each range sampled.
Most of these ranges have no echo energy; only externally generated manmade and natural noise or interference
from radio transmitters. If a particular ionospheric layer is providing an echo, each height profile will have sig-
nificant amplitude at the height corresponding to that layer. By Fourier transforming each row of the coherent
buffer a Doppler spectrum describing the radial velocity of that layer will be produced. Notice that the sam-
pling frequency at that layer is less than or equal to the pulse repetition frequency (on the order of 100 Hz).
1:63. After the sequence of N pulses is processed, the pulse compression and Doppler integration have re-
sulted in a Doppler spectrum stored in memory for each range bin, each antenna, each polarization, and each
frequency measured. The program now scans through each spectrum and selects the largest one amplitude per
height. This amplitude is converted to a logarithmic magnitude (dB units) and placed into a new one-
dimensional array representing a height profile containing only the maximum amplitude echoes. This tech-
nique of selecting the maximum Doppler amplitude at each height is called the modified maximum method, or
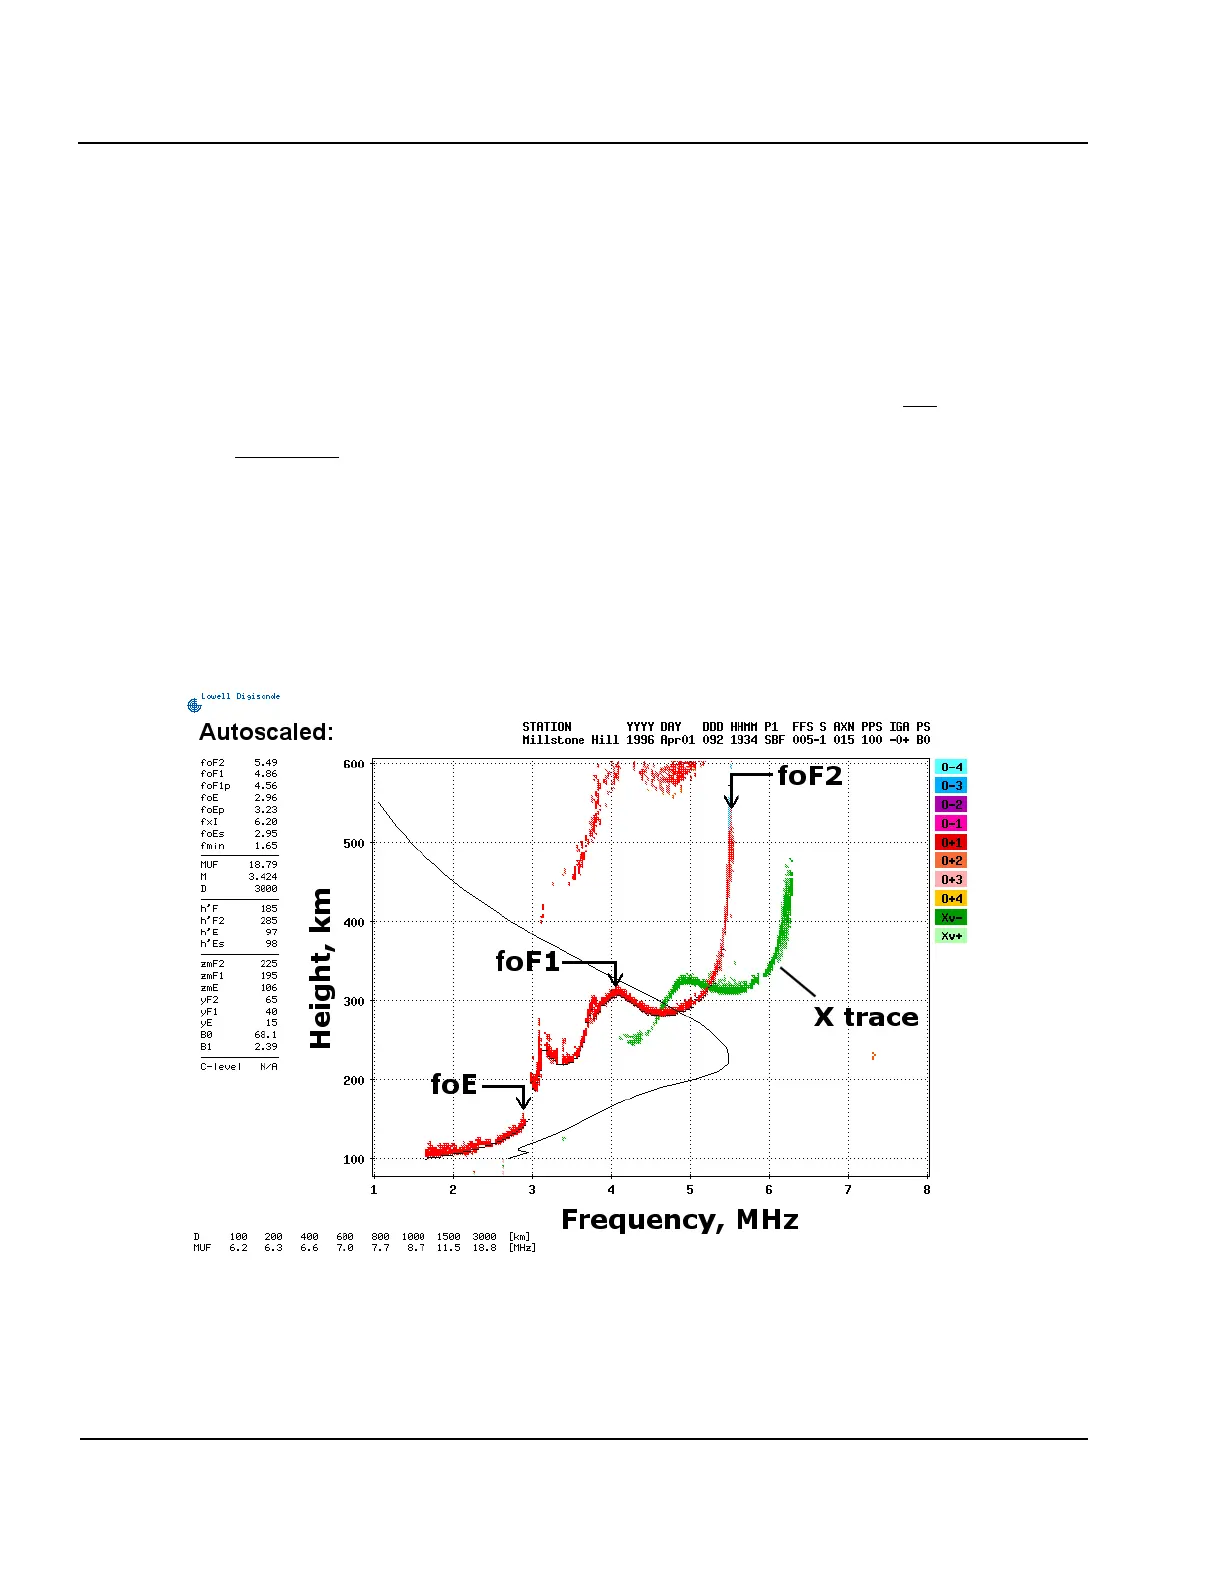
MMM. If the MMM height profile array is plotted for each frequency step made, this results in an ionogram
display, such as the one shown in Figure 1-17.
Figure 1-17: Ionogram Consisting of Amplitudes of Maximum Doppler Lines
Radio Frequency Interference Mitigation (RFIM)