LDI Intellectual Property.
Not for secondary distribution or replication, in part or entirety.
DIGISONDE-4D
SYSTEM MANUAL
VERSION 1.2.11
1-42 SECTION 1 - GENERAL SYSTEM DESCRIPTION
by the need to capture highly voluminous time-domain data for processing, until release of the Digisonde-4D
model in 2007-2008 whose high bandwidth interfaces and modern embedded computers were adequate for the
task.
1:94. In order to use the DPS system for the oblique sounding with signals from external transmitters of op-
portunity, there is an important problem to be solved. It concerns the inconsistency between the DPS effective
sampling rate and the frequency bandwidth of the receive signals. To generate a valid digital presentation of the
received broadcasting signal, the sampling rate must be at least twice the signal bandwidth. The maximum
number of samples in the DPS spectrum is 128. With an integration time of 40 sec this results in a sampling
rate of 3.2 Hz and an unambiguous spectral range of 1.6 Hz (considering the quadrature sampling). The sig-
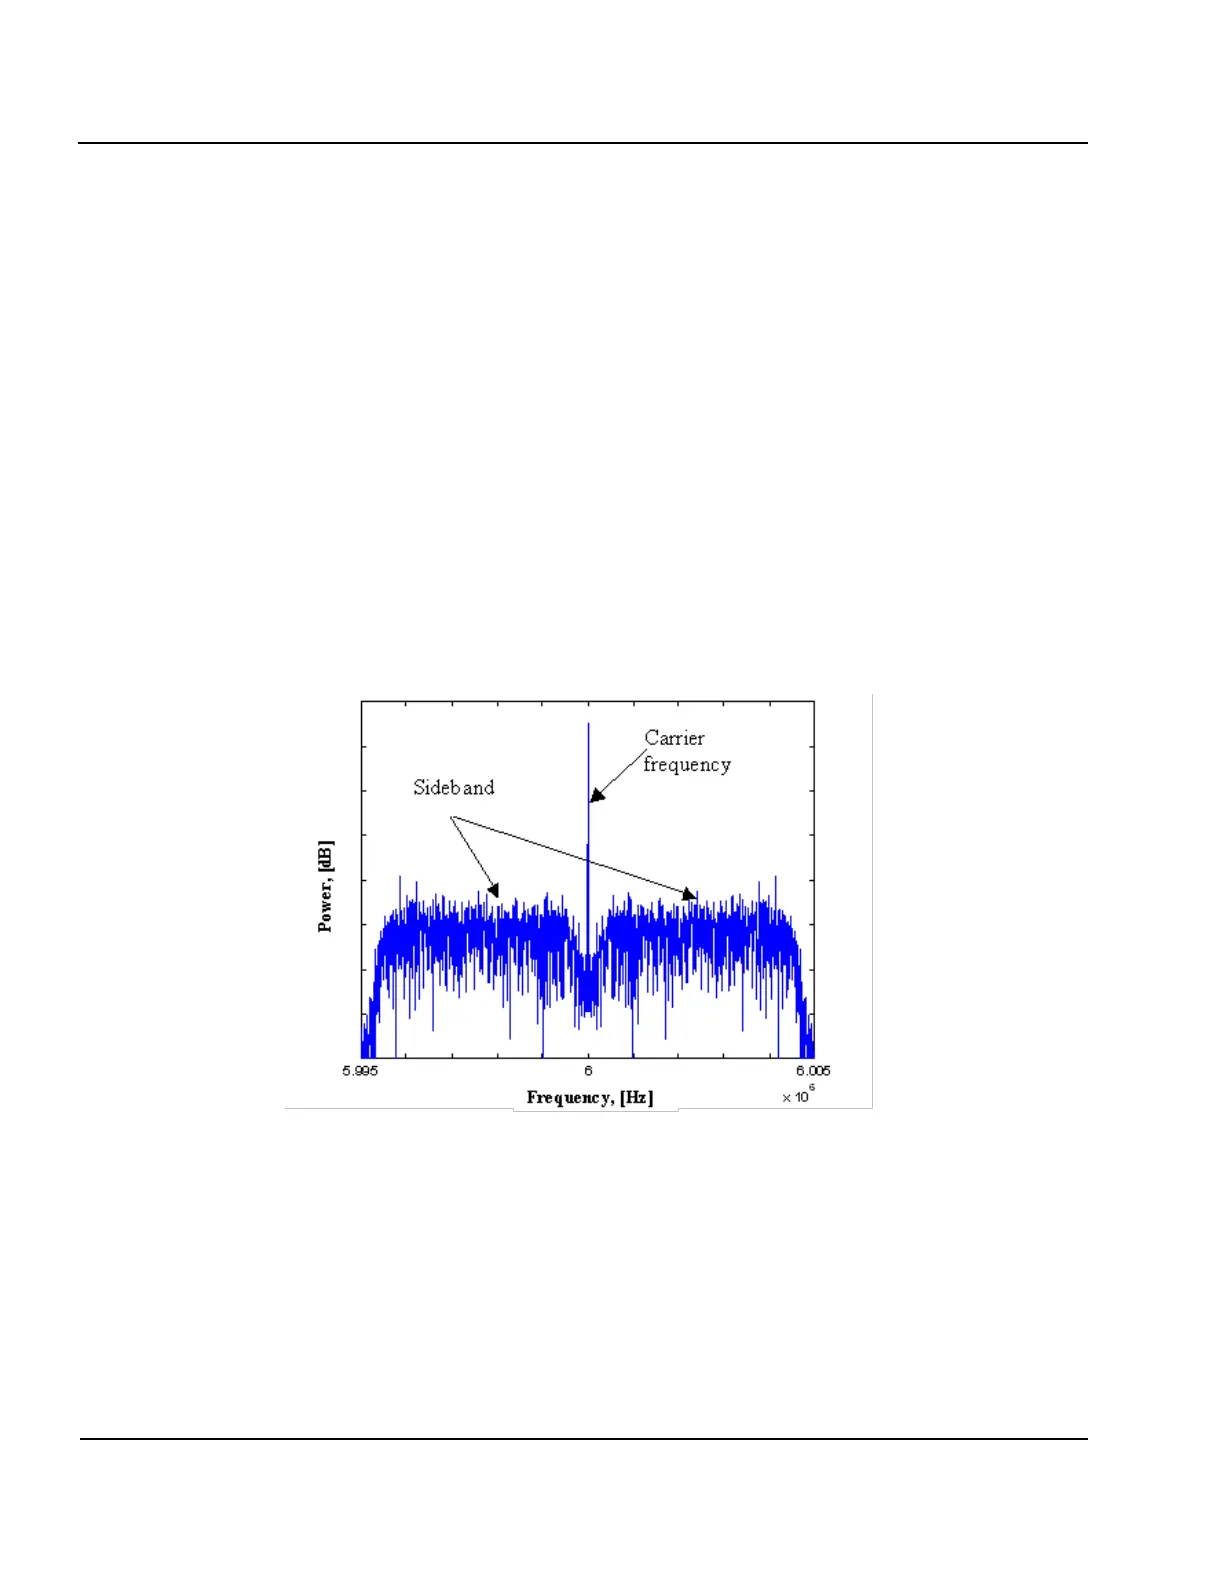
nals of most broadcasting stations have a bandwidth of the order of 5 kHz [FCC Regulations, 1998] as shown
in Figure 1-24. Because of the low effective sampling rate and large receive bandwidth, the side modulation
frequency (sideband) components would be “aliased”, or “folded” into the frequency band of the analysis and
distort the measurements. If one were only to measure the Doppler frequency shift of the signal, this effect
would not present a significant problem as long as the carrier frequency spectral line has an amplitude signifi-
cantly larger than that of the sideband, which is usually the case (carrier frequency is at least 20 dB stronger
than the sidebands). But signal angles of arrival are calculated from the phase measurements, and for these pa-
rameters the aliasing effect is a problem. This is because the phases of the sideband spectral components are
random-like and fluctuate significantly during the coherent integration time.
Figure 1-24: Spectrum of the Signal of Broadcasting Stations with 6 MHz Carrier Frequency.
1:95. To remove the aliasing effect, it is necessary to either increase the sampling rate, or decrease the re-
ceiver bandwidth by using a narrow-band filter, either analog or digital. Implementing a digital filter provides
certain advantages, mainly the flexibility of the system, and requires no additional hardware parts. Such a filter
was designed and implemented as a part of this work.
1:96. Figure 1-25 helps understanding the digital filtering algorithm. To simplify the picture only real sam-
ples of the digitized signal are drawn, and a single operating frequency is assumed. The top panel shows the