11-10
NrSrd +=)660(Re
NiSiIr +=)940(
SiSrR /=
Again, R is the ratio of two arterial pulse-added absorbance signals and its value is used to find
the saturation SpO
2
in an empirically derived equation into the software. The values in the
empirically derived equation are based upon human blood studies against a laboratory
co-oximeter on healthy adult volunteers in induced hypoxia studies.
The above equations are combined and a noise reference (N’) is determined:
RIrdN ×−= )940()660(Re'
The equation for the noise reference is based on the value of R, the value being seeked to
determine the SpO
2
. This instrument’s software sweeps through possible values of R that
correspond to SpO
2
values between 1% and 100% and generates an N’ value for each of these R
values. The S (660) and S (940) signals are processed with each possible N’ noise reference
through an adaptive correlation canceler (ACC) which yields an output power for each possible
value of R (i.e., each possible SpO
2
from 1% to 100%). The result is a Discrete Saturation
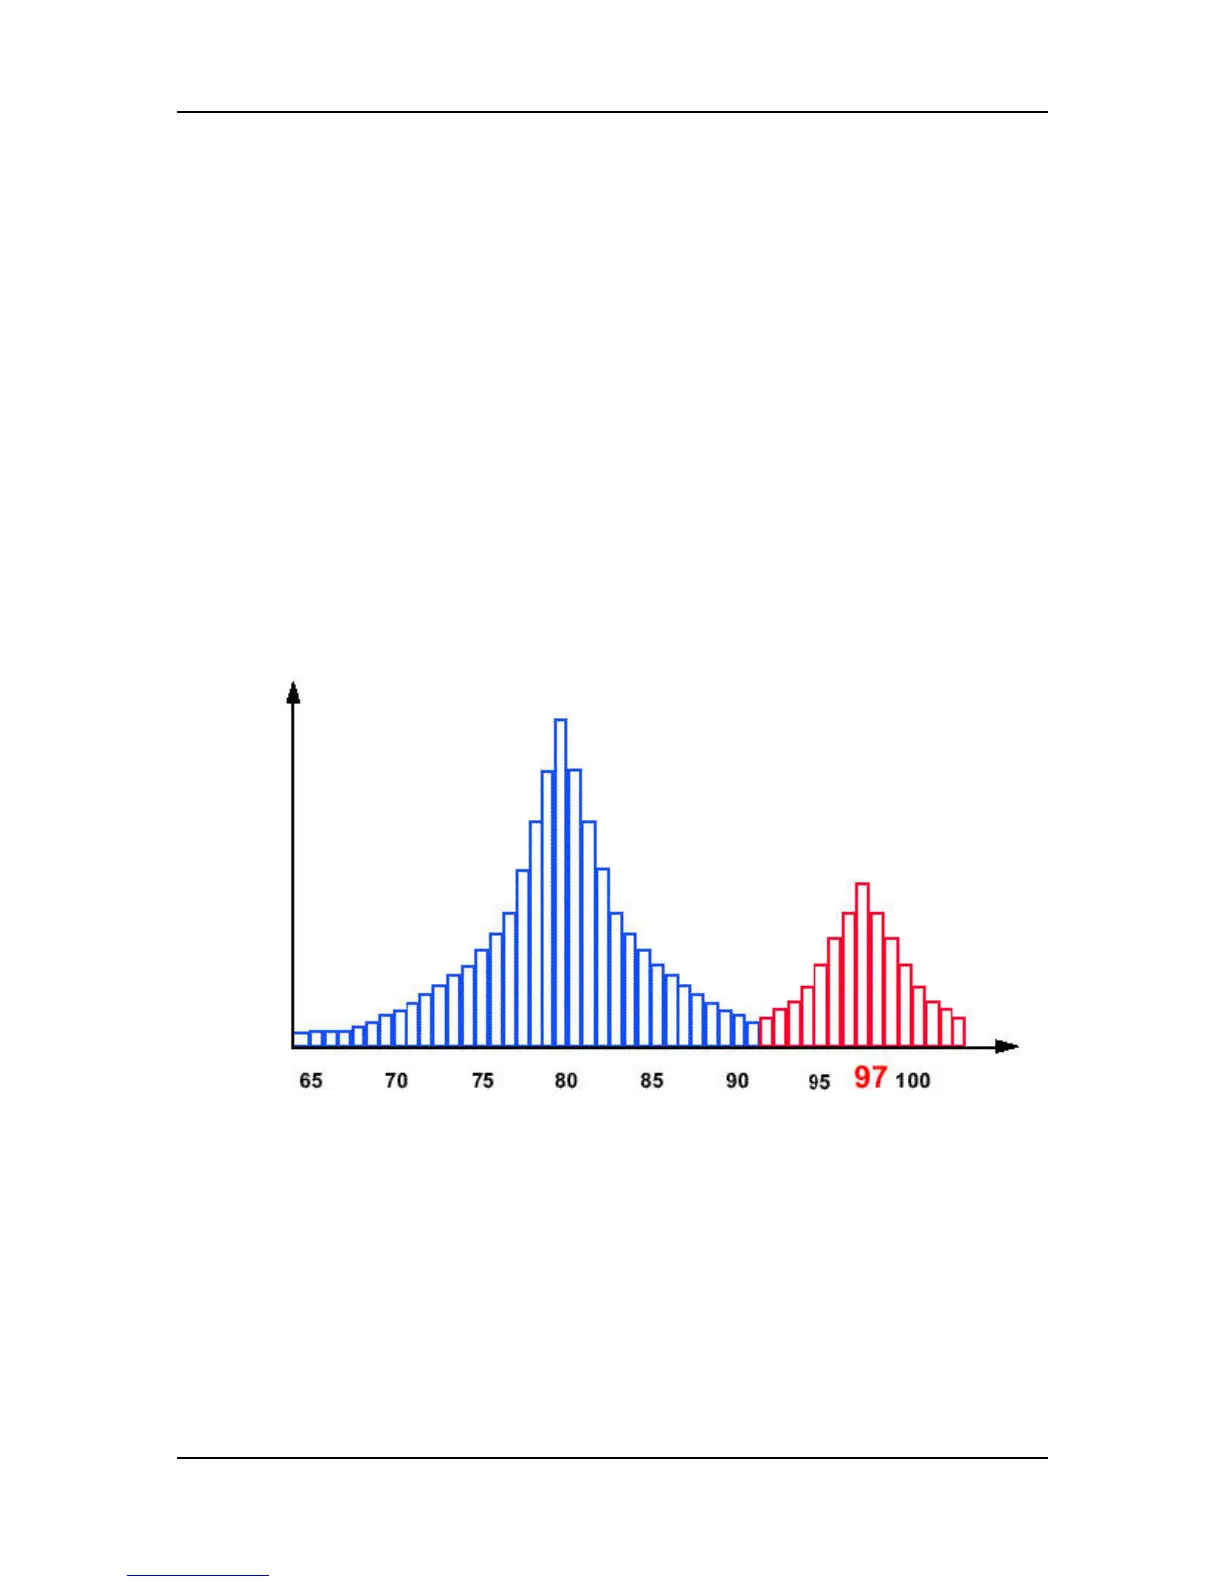
Transform (DST™) plot of relative output power versus possible SpO2 value as shown in the
following figure where R corresponds to SpO
2
= 97%:
The DST plot has two peaks: the peak corresponding to the higher saturation is selected as the
SpO
2
value. This entire sequence is repeated once every two seconds on the most recent four
seconds of raw data. The SpO
2
value therefore corresponds to a running average of arterial
hemoglobin saturation that is updated every two seconds.
SpO
2
%
Discrete Saturation Transform DST
TM
Relative Correlation Canceler
Emergy Output