DMTA-10026-01EN, Rev. D, January 2015
Chapter 5
98
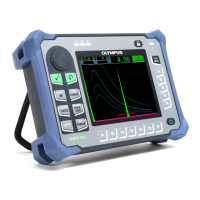
Figure 5-7 Strip chart view with and without statistics
To set the strip chart view
1. In the measurement screen, press [SET UP], and then highlight STRIP CHART
VIEW.
2. In the STRIP CHART VIEW submenu, select ENABLE, MAX RANGE, MIN
RANGE, or LIVE STATS.
3. In the STRIP CHART VIEW screen (see Figure 5-8 on page 99):
a) Set ENABLE to ON to activate the strip chart function.
b) Set the desired value in the MAX RANGE field to define the upper limit of
the strip chart.
c) Set the desired value in the MIN RANGE field to define the lower limit of the
strip chart.
d) Set LIVE STATS to ON to view the live statistics for the strip chart view:
minimum (MIN), maximum (MAX), and AV E R A G E values.
e) Press [MEAS] to return to the measurement screen.
Strip chart with statistics
Strip chart without statistics
 Loading...
