Functions
7.14 Reflexor
FUS1010 IP65 NEMA 4X & IP66 NEMA 7
146 Operating Instructions, 01/2013, A5E02951520-AC
Selecting the Spectra Graph Display
1. In the [Install Sensor] menu scroll to [Spectra Graph] and press the <Right Arrow>.
2. Press the <Down Arrow>to select [Yes] and press <ENTER>.
,QVWDOO6HQVRU
6LHPHQV &KDQQHO>@$%&
'LVSOD\))76SHFWUXPDQG'DWD&RQWUROV
6HQVRU0RGHO 8QLYHUVDO
6HQVRU6L]H
&
)ORZ5DQJH*$/0,1
,QVWDOO&RPSOHWH <HV
6SHFWUD*UDSK 1R
!<HV
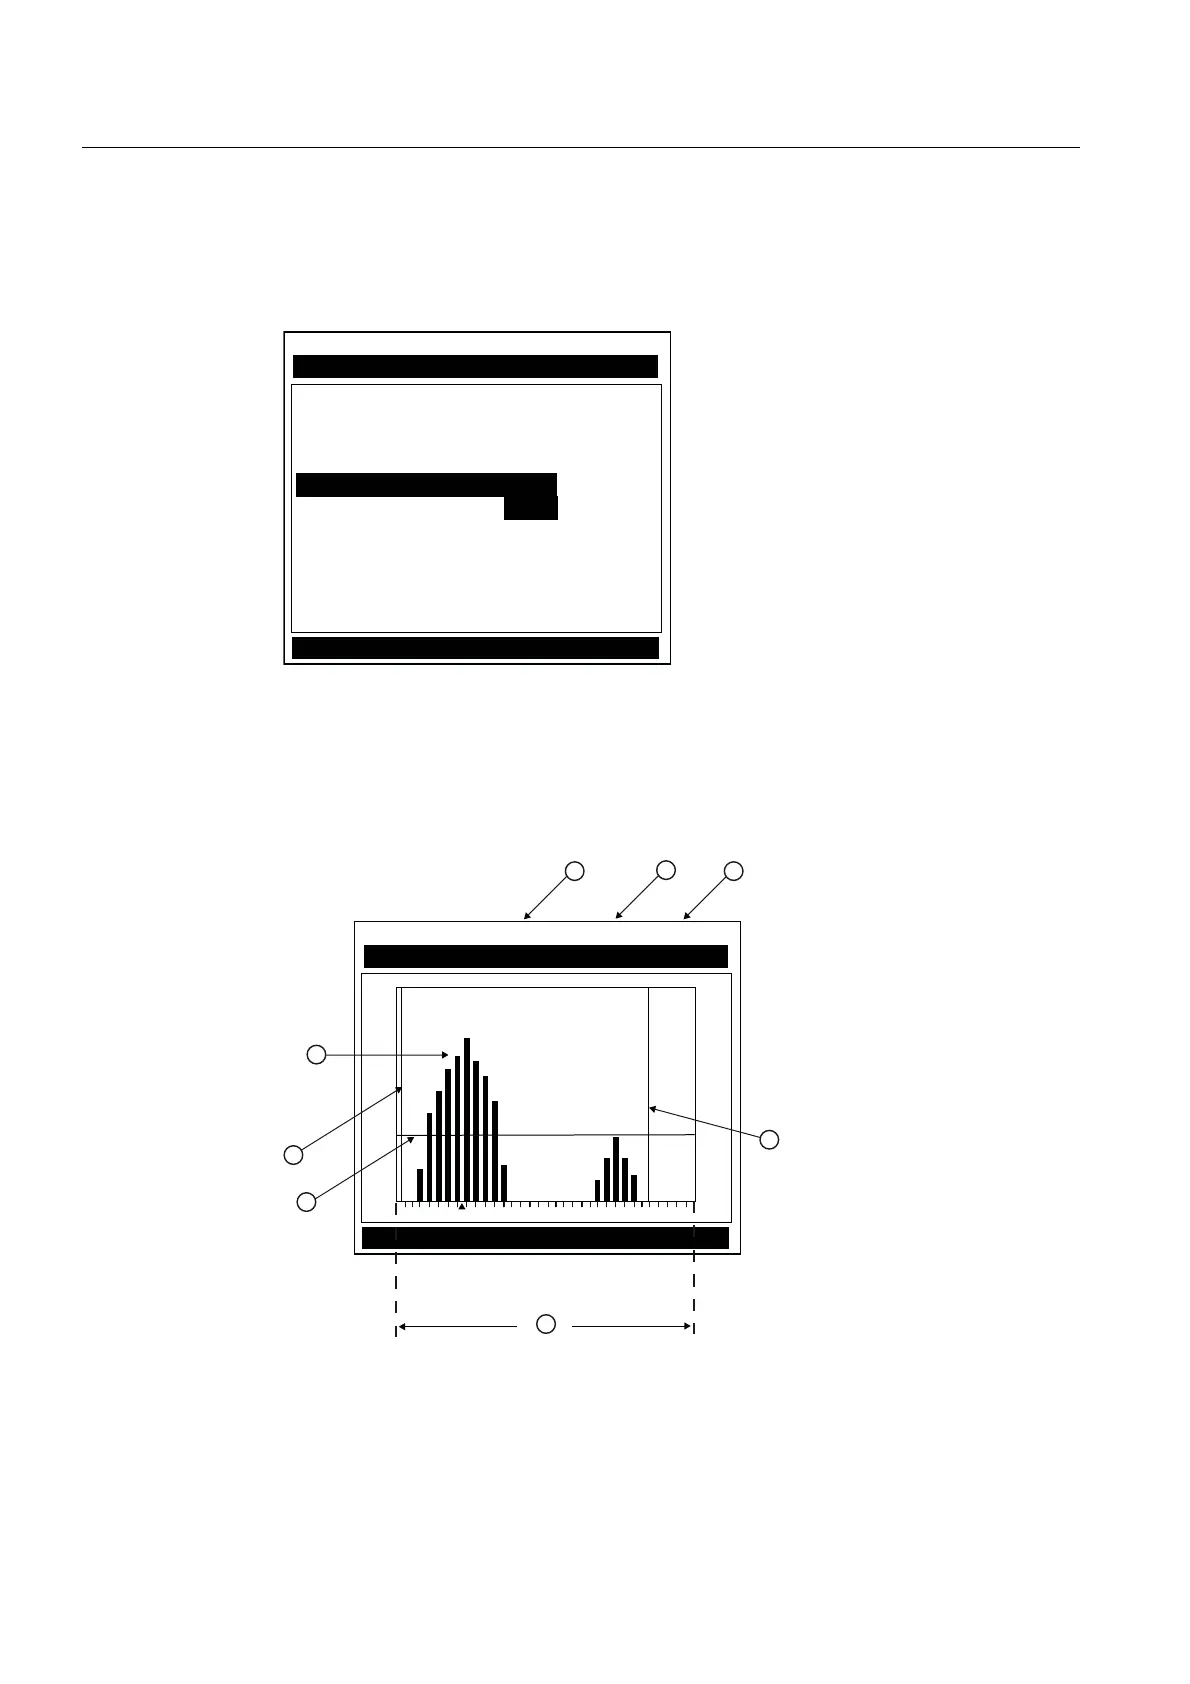
The Spectra Graph display shows the results of the Fast Fourier Transform (FFT) performed
by the flow meter.
● The horizontal scale represents flow velocity with the higher velocities on the right and
lower velocities on the left.
● The vertical axis is relative amplitude or magnitude; each bar shows the relative
amplitude for a velocity range.
,QVWDOO;GFU
6LHPHQV &KDQQHO>@$%&
9HORFLW\)6 *$/0,1
① Meter Type ⑤ Flow Velocity Range
② Measurement Channel ⑥ Noise Level Set Cursor
③ Site Name ⑦ Low Limit Cursor
④ High Limit Cursor ⑧ Signal Amplitude
Figure 7-5 Spectra Graph Display Screen