CHAPTER 7 Quality control
Sysmex XE-5000 Instructions for Use 7-7
Revised April 2007
7.5 QC data display
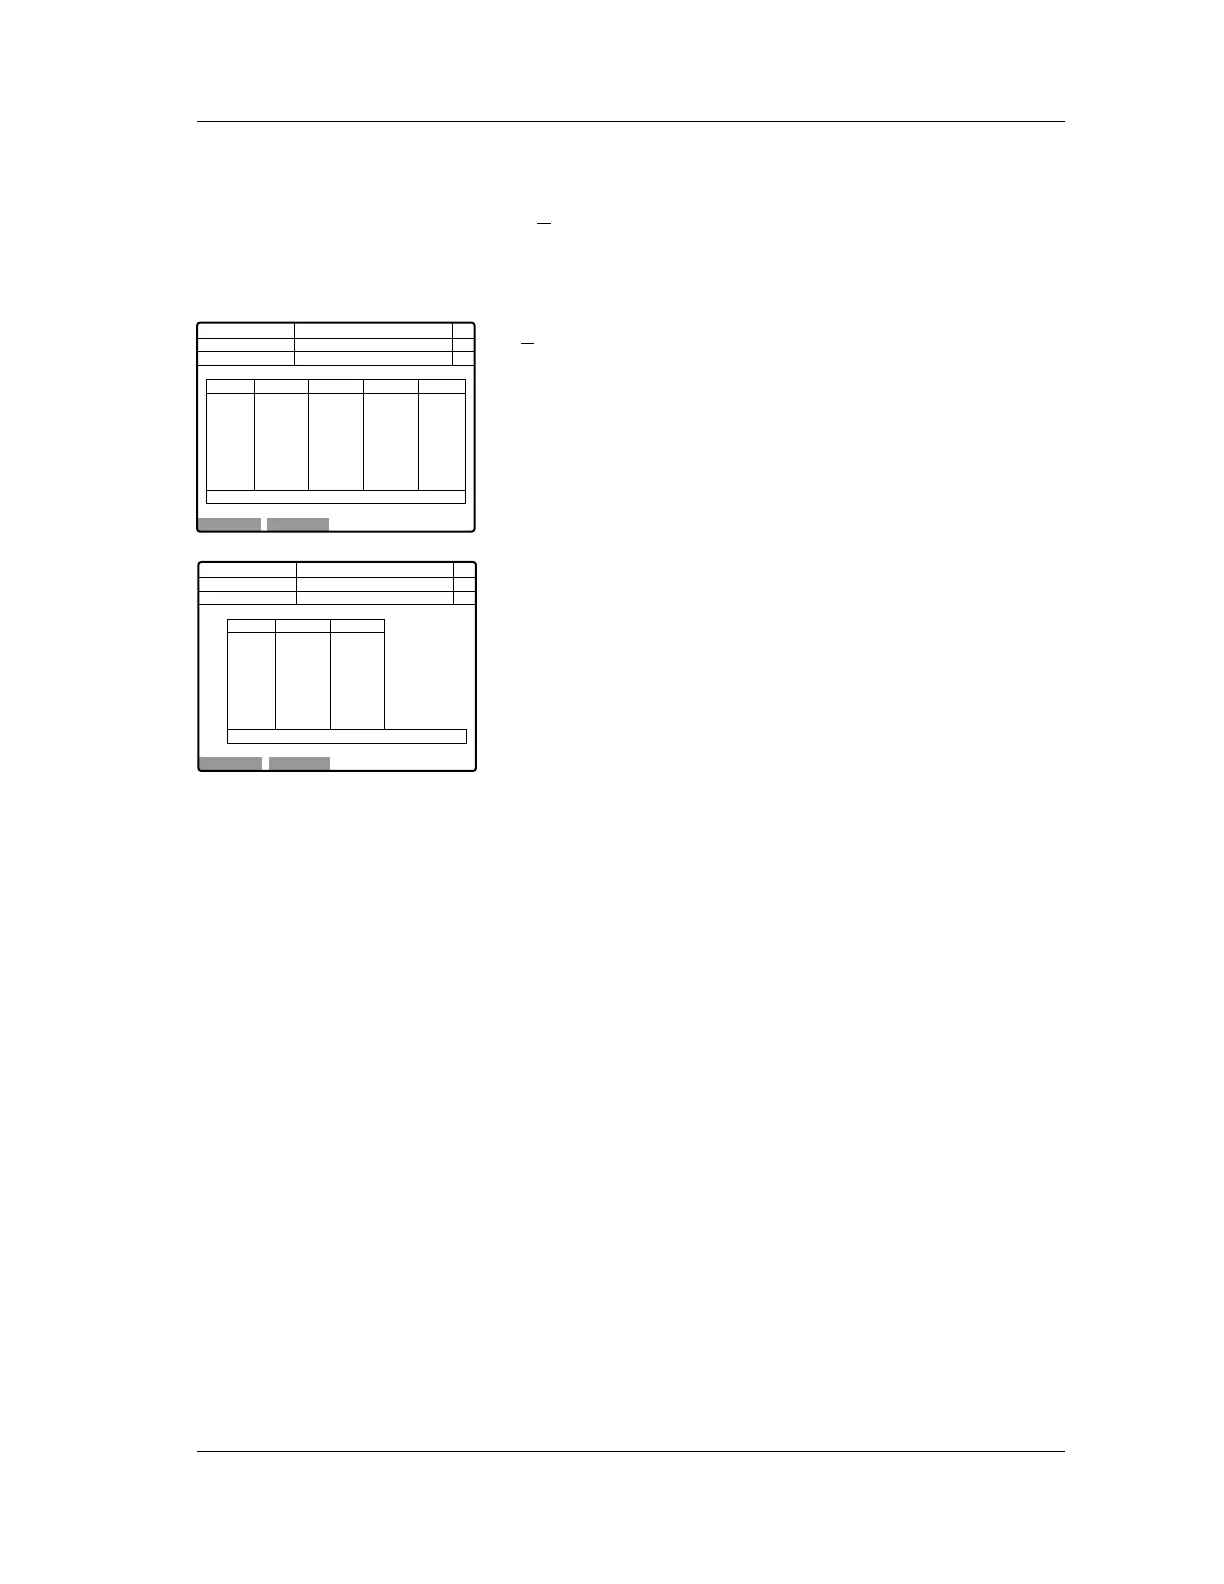
After the analysis is completed, the results are displayed.
If X
control is used as control data, the data in the “Mean”
column is stored; in the L-J control, the latest data is stored.
The control data will be stored when it is displayed on the
LCD screen.
X
control display
L-J control display
If the message “CHECK CONTROL CHART” appears in the
action message column, the analyzed data has exceeded the
control limit. If the message “REANALYZE CONTROL”
appears, the analyzed data is more than 3 times the limit.
The “+” and “-” signs in the judgment column indicate which
parameters are outside the control limits and which are above
or below the limits. (When analyzed data is more than 3 times
the limit, “+” and “-” will be highlighted.)
Next No.123456789012346
DP No. 123456789012345
Manual
Normal
Not Ready
X1 X2 Mean Judge
WBC
RBC
HGB
HCT
MCV
MCH
MCHC
7.71
4.54
12.3
32.7
77.1
25.7
33.3
7.73
4.55
12.3
32.9
77.3
25.9
33.7
7.72
4.54
12.3
32.8
77.2
25.8
33.5
C D N R
LOT:12345678 <Execute Xbar>
Num
DP
Xm
OK Cancel
Next No.123456789012346
DP No. 123456789012345
D1 Judge
Manual
Normal
Not Ready
WBC
RBC
HGB
HCT
MCV
MCH
MCHC
7.71
4.54
12.3
32.7
77.1
25.7
33.3
C D N R
LOT:12345678 <Execute L-J>
Num
DP
Xm
OK Cancel