Chapter 3: Function Graphing 104
Note: When é or ê is selected for a Y= function that graphs a family of curves, such as
Y1={1,2,3}X, the four shading patterns rotate for each member of the family of curves.
Setting a Graph Style from a Program
Setting a Graph Style from a ProgramSetting a Graph Style from a Program
Setting a Graph Style from a Program
To set the graph style from a program, select
H:GraphStyle( from the PRGM CTL menu.
To display this menu, press while in the program editor.
function# is the number of
the Y= function name in the current graphing mode.
graphstyle# is an integer from 1 to 7
that corresponds to the graph style, as shown below.
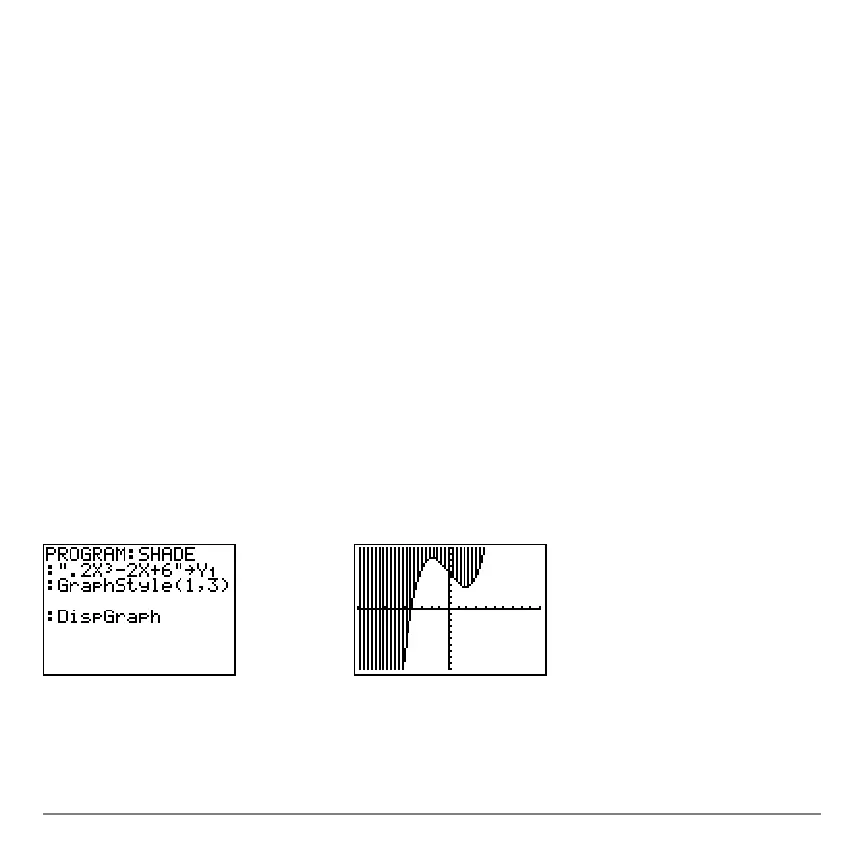
GraphStyle(function#,graphstyle#)
For example, when this program is executed in Func mode, GraphStyle(1,3) sets Y1 to
é (above).
1 = ç (line)
2 = è (thick)
3 = é (above)
4 = ê (below)
5
= ë (path)
6 = ì (animate)
7 = í (dot)

 Loading...


