Chapter 6: Sequence Graphing 167
2. It moves vertically (up or down) to the sequence.
3. It moves horizontally to the
y=x reference line.
4. It repeats this vertical and horizontal movement as you continue to press ~.
Using Web Plots to Illustrate Convergence
Using Web Plots to Illustrate ConvergenceUsing Web Plots to Illustrate Convergence
Using Web Plots to Illustrate Convergence
Example: Convergence
Example: ConvergenceExample: Convergence
Example: Convergence
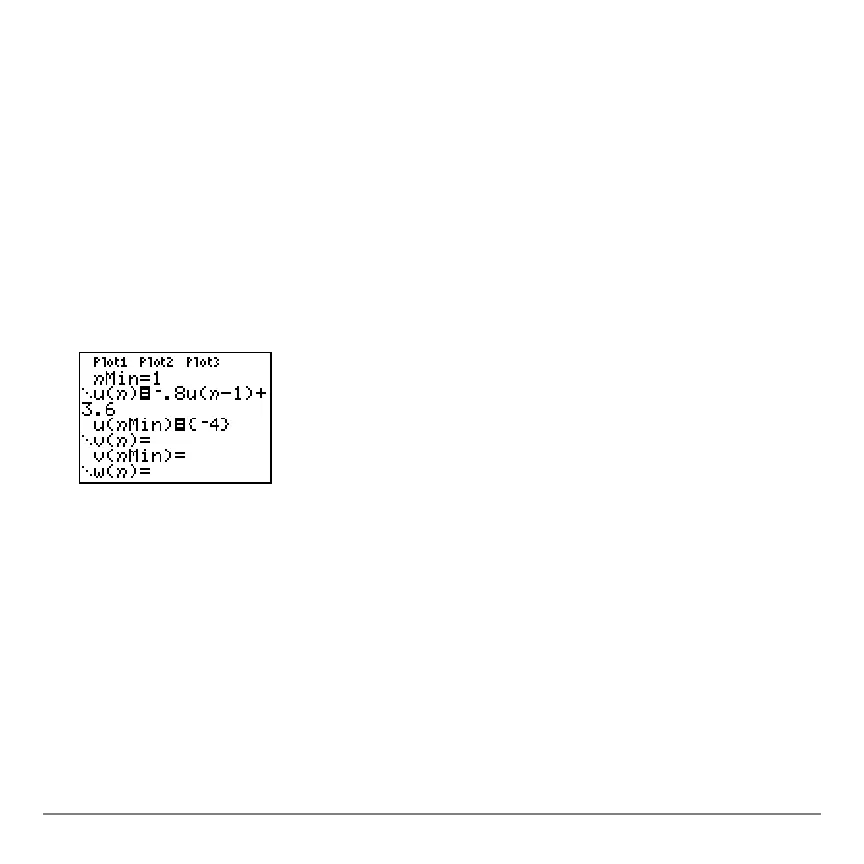
1. Press o in
Seq mode to display the sequence Y= editor. Make sure the graph style is
set to í (dot), and then define
nMin, u(n) and u(nMin) as shown below.
2. Press y . Í to set
Time axes format.
3. Press p and set the variables as shown below.
4. Press s to graph the sequence.
nMin=1
nMax=25
PlotStart=1
PlotStep=1
Xmin=0
Xmax=25
Xscl=1
Ymin=
L10
Ymax=10
Yscl=1

 Loading...


