EasyManuals Logo
Home>Texas Instruments>Calculator>TI-84 Plus

Texas Instruments TI-84 Plus Guide Book

Texas Instruments TI-84 Plus
696 pages
To Next Page IconTo Next Page
To Previous Page IconTo Previous Page
Page #324 background imageLoading...
Page #324 background image
Chapter 12: Statistics 321
in the middle. When three are plotted, the first one plots at the top, the second in the
middle, and the third at the bottom.
Boxplot
BoxplotBoxplot
Boxplot
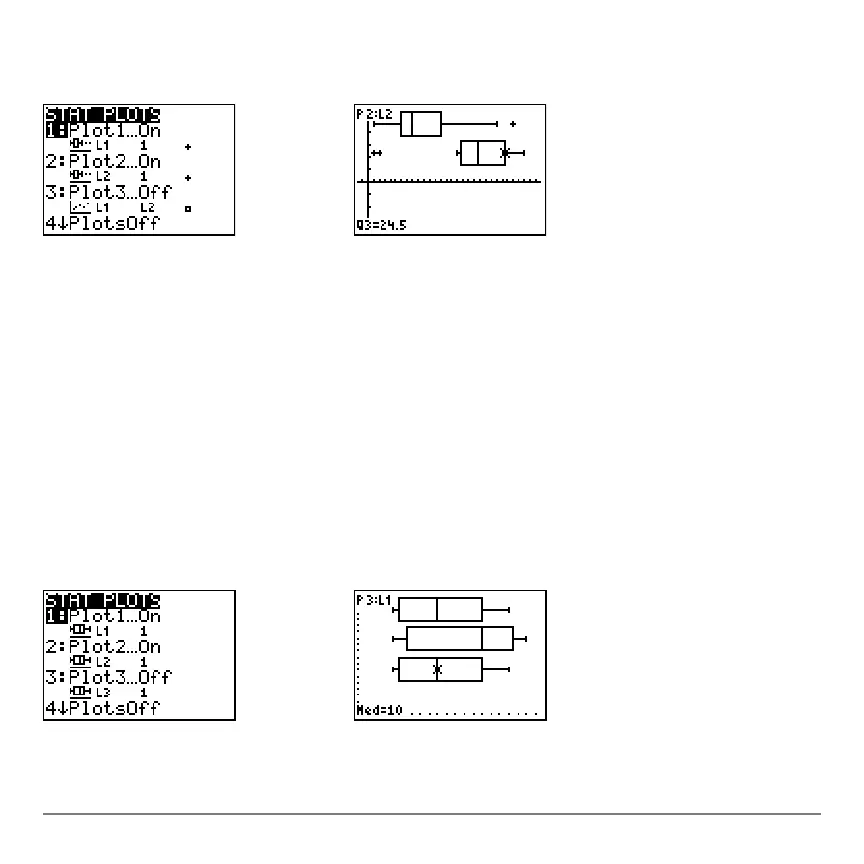
Boxplot (Ö)(regular box plot) plots one-variable data. The whiskers on the plot extend
from the minimum data point in the set (
minX) to the first quartile (Q1) and from the third
quartile (
Q3) to the maximum point (maxX). The box is defined by Q1, Med (median), and
Q3.
Box plots are plotted with respect to
Xmin and Xmax, but ignore Ymin and Ymax. When
two box plots are plotted, the first one plots at the top of the screen and the second plots
in the middle. When three are plotted, the first one plots at the top, the second in the
middle, and the third at the bottom.

Table of Contents

Other manuals for Texas Instruments TI-84 Plus

Questions and Answers:

Question and Answer IconNeed help?

Do you have a question about the Texas Instruments TI-84 Plus and is the answer not in the manual?

Texas Instruments TI-84 Plus Specifications

General IconGeneral
Battery typeAAA
Power sourceBattery
Number of batteries supported4
TypeGraphing
CoverNo
Form factorPocket
Control typeButtons
Product colorBlack
USB portYes
USB 2.0 ports quantity1
Digits- digits
Display number of lines8 lines
Display number of characters16
RAM capacity0.024 MB
ROM capacity0.480 MB
Storage media type-

Related product manuals