Chapter 4: Parametric Graphing 140
Displaying a Graph
Displaying a GraphDisplaying a Graph
Displaying a Graph
When you press s, the TI-84 Plus plots the selected parametric equations. It
evaluates the X and Y components for each value of
T (from Tmin to Tmax in intervals of
Tstep), and then plots each point defined by X and Y. The window variables define the
viewing window.
As the graph is plotted, X, Y, and T are updated.
Smart Graph applies to parametric graphs.
Window Variables and Y
Window Variables and YWindow Variables and Y
Window Variables and Y.
..
.VARS Menus
VARS MenusVARS Menus
VARS Menus
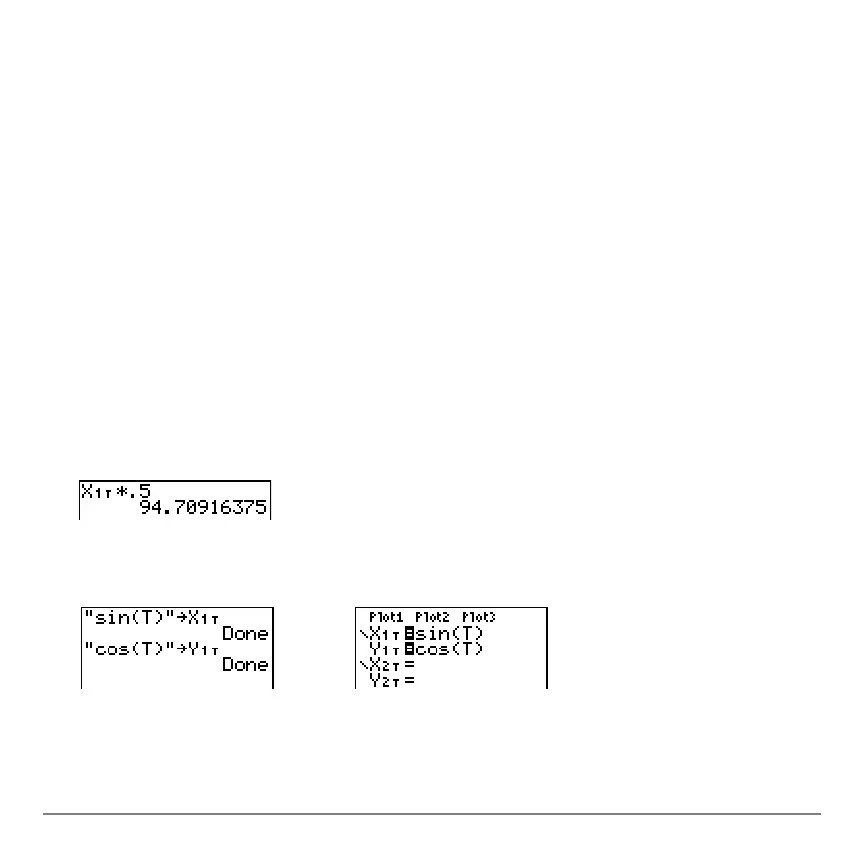
You can perform these actions from the home screen or a program.
• Access functions by using the name of the
X or Y component of the equation as a
variable.
• Store parametric equations.

 Loading...


