Chapter 5: Polar Graphing 146
Setting Polar Graphing Mode
Setting Polar Graphing ModeSetting Polar Graphing Mode
Setting Polar Graphing Mode
To display the mode screen, press z. To graph polar equations, you must select Pol
graphing mode before you enter values for the window variables and before you enter
polar equations.
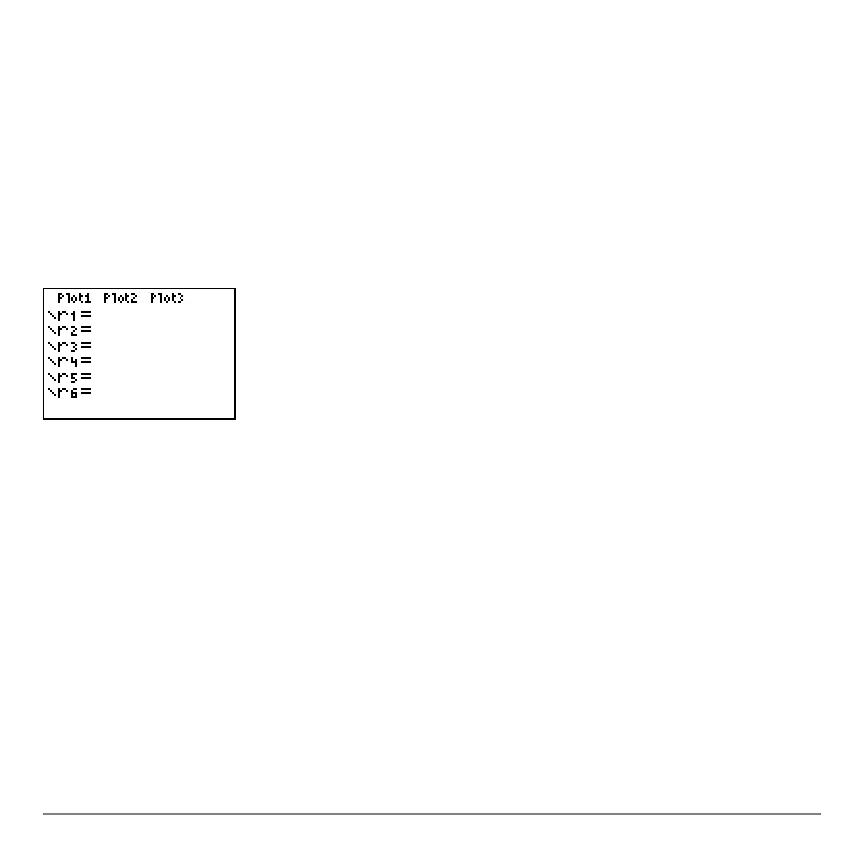
Displaying the Polar Y= Editor
Displaying the Polar Y= EditorDisplaying the Polar Y= Editor
Displaying the Polar Y= Editor
After selecting Pol graphing mode, press o to display the polar Y= editor.
In this editor, you can enter and display up to six polar equations,
r1 through r6. Each is
defined in terms of the independent variable q.
Selecting Graph Styles
Selecting Graph StylesSelecting Graph Styles
Selecting Graph Styles
The icons to the left of
r1 through r6 represent the graph style of each polar equation.
The default in Pol graphing mode is ç (line), which connects plotted points. Line,
è (thick), ë (path), ì (animate), and í (dot) styles are available for polar graphing.

 Loading...


