Chapter 5: Polar Graphing 145
Defining and Displaying Polar Graphs
Defining and Displaying Polar GraphsDefining and Displaying Polar Graphs
Defining and Displaying Polar Graphs
TI-84 Plus Graphing Mode Similarities
TI-84 Plus Graphing Mode SimilaritiesTI-84 Plus Graphing Mode Similarities
TI-84 Plus Graphing Mode Similarities
The steps for defining a polar graph are similar to the steps for defining a function graph.
Chapter 5 assumes that you are familiar with Chapter 3: Function Graphing. Chapter 5
details aspects of polar graphing that differ from function graphing.
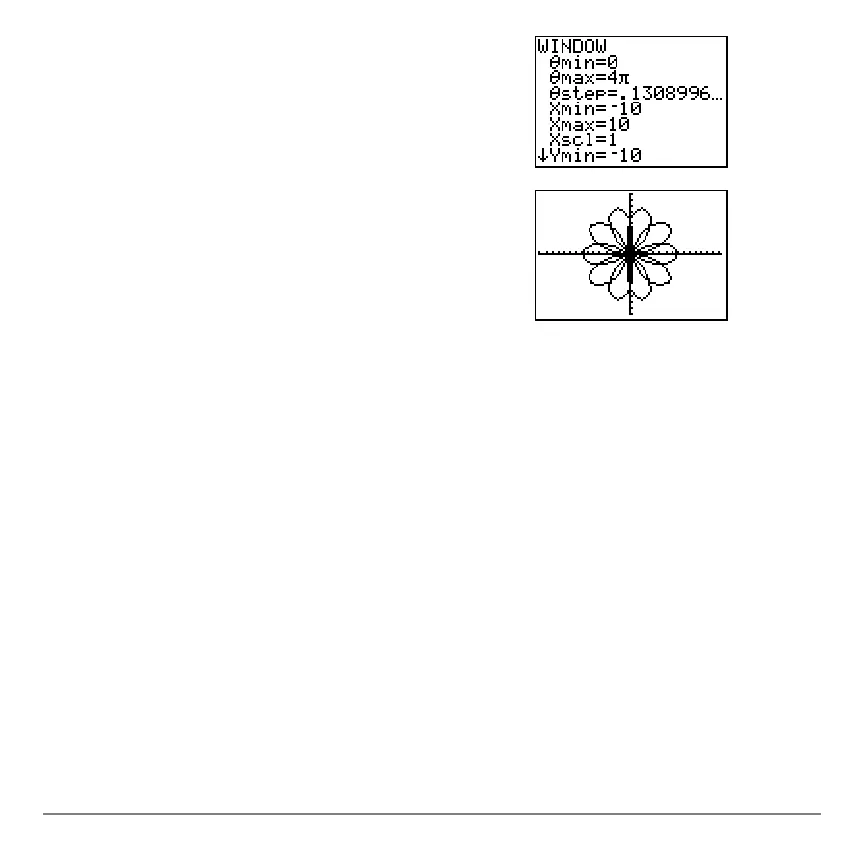
4. Press p to display the window variables.
Press †
4 yB to increase the value of qmax to
4p.
5. Press q
5 to select 5:ZSquare and plot the
graph.
6. Repeat steps 2 through 5 with new values for the
variables
A and B in the polar equation
r1=Asin(Bq). Observe how the new values affect
the graph.

 Loading...


