Chapter 17: Activities 483
Graphing Inequalities
Graphing InequalitiesGraphing Inequalities
Graphing Inequalities
Problem
ProblemProblem
Problem
Graph the inequality 0.4x
3
N 3x + 5 < 0.2x + 4. Use the
TEST menu operations to explore
the values of X where the inequality is true and where it is false.
Procedure
ProcedureProcedure
Procedure
1. Press z. Select
Dot, Simul, and the default settings. Setting Dot mode changes
all graph style icons to í (dot) in the
Y= editor.
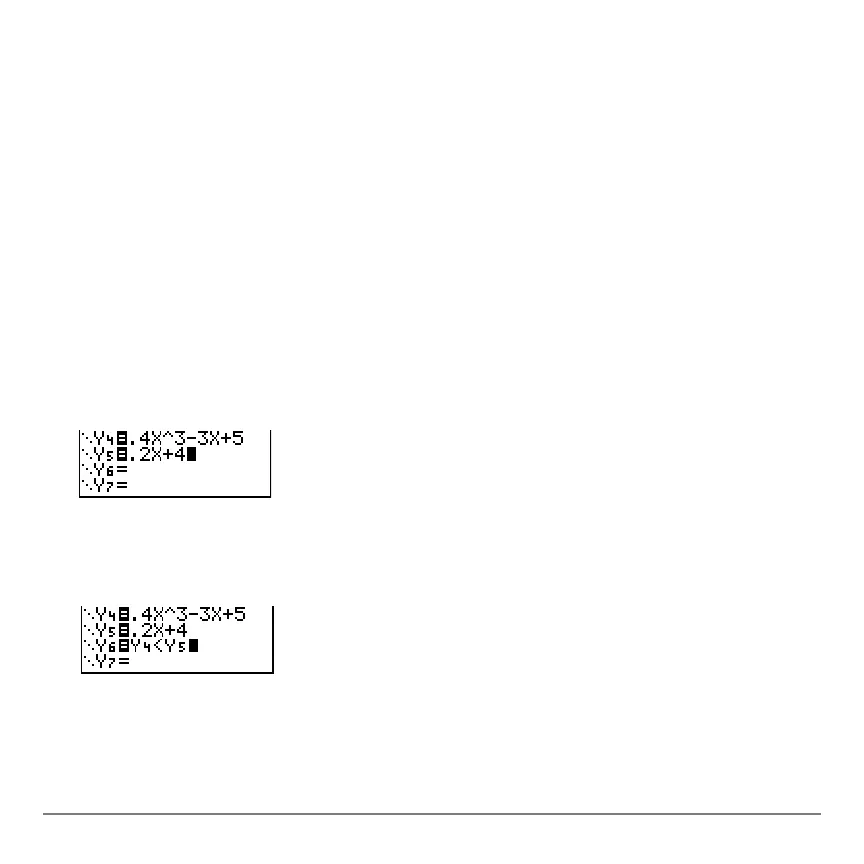
2. Press o. Turn off all functions and stat plots. Enter the left side of the inequality as
Y4
and the right side as
Y5.
3. Enter the statement of the inequality as
Y6. This function evaluates to 1 if true or 0 if
false.
4. Press q
6 to graph the inequality in the standard window.
5. Press r † † to move to
Y6. Then press | and ~ to trace the inequality,
observing the value of
Y.

 Loading...


