EasyManuals Logo

Texas Instruments TI-84 Plus Guide Book

Texas Instruments TI-84 Plus
696 pages
To Next Page IconTo Next Page
To Previous Page IconTo Previous Page
Page #325 background imageLoading...
Page #325 background image
Chapter 12: Statistics 322
NormProbPlot
NormProbPlotNormProbPlot
NormProbPlot
NormProbPlot (Ô) (normal probability plot) plots each observation X in Data List versus
the corresponding quantile z of the standard normal distribution. If the plotted points lie
close to a straight line, then the plot indicates that the data are normal.
Enter a valid list name in the
Data List field. Select X or Y for the Data Axis setting.
If you select X, the TI-84 Plus plots the data on the x-axis and the z-values on the
y-axis.
If you select Y, the TI-84 Plus plots the data on the y-axis and the z-values on the
x-axis.
Defining the Plots
Defining the PlotsDefining the Plots
Defining the Plots
To define a plot, follow these steps.

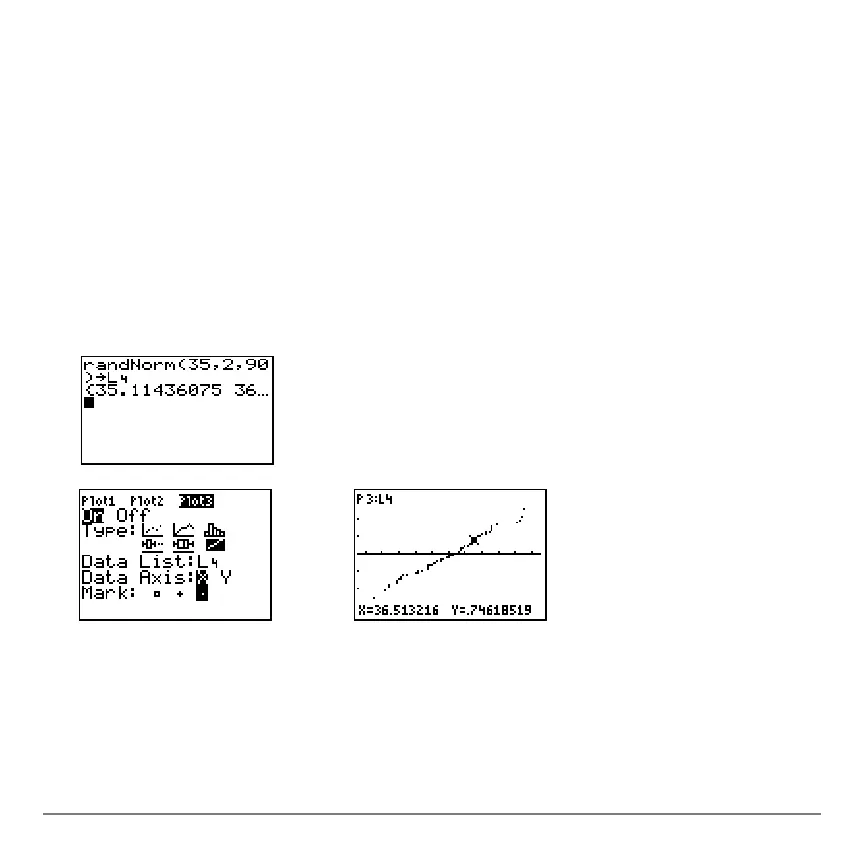
Table of Contents

Other manuals for Texas Instruments TI-84 Plus

Questions and Answers:

Question and Answer IconNeed help?

Do you have a question about the Texas Instruments TI-84 Plus and is the answer not in the manual?

Texas Instruments TI-84 Plus Specifications

General IconGeneral
Battery typeAAA
Power sourceBattery
Number of batteries supported4
TypeGraphing
CoverNo
Form factorPocket
Control typeButtons
Product colorBlack
USB portYes
USB 2.0 ports quantity1
Digits- digits
Display number of lines8 lines
Display number of characters16
RAM capacity0.024 MB
ROM capacity0.480 MB
Storage media type-

Related product manuals