Chapter 3: Function Graphing 93
Defining Graphs
Defining GraphsDefining Graphs
Defining Graphs
TI-84 Plus—Graphing Mode Similarities
TI-84 Plus—Graphing Mode SimilaritiesTI-84 Plus—Graphing Mode Similarities
TI-84 Plus—Graphing Mode Similarities
Chapter 3 specifically describes function graphing, but the steps shown here are similar
for each TI-84 Plus graphing mode. Chapters 4, 5, and 6 describe aspects that are
unique to parametric graphing, polar graphing, and sequence graphing.
2. Press q
6 to select 6:ZStandard. This is a
quick way to reset the window variables to the
standard values. It also graphs the functions; you
do not need to press s.
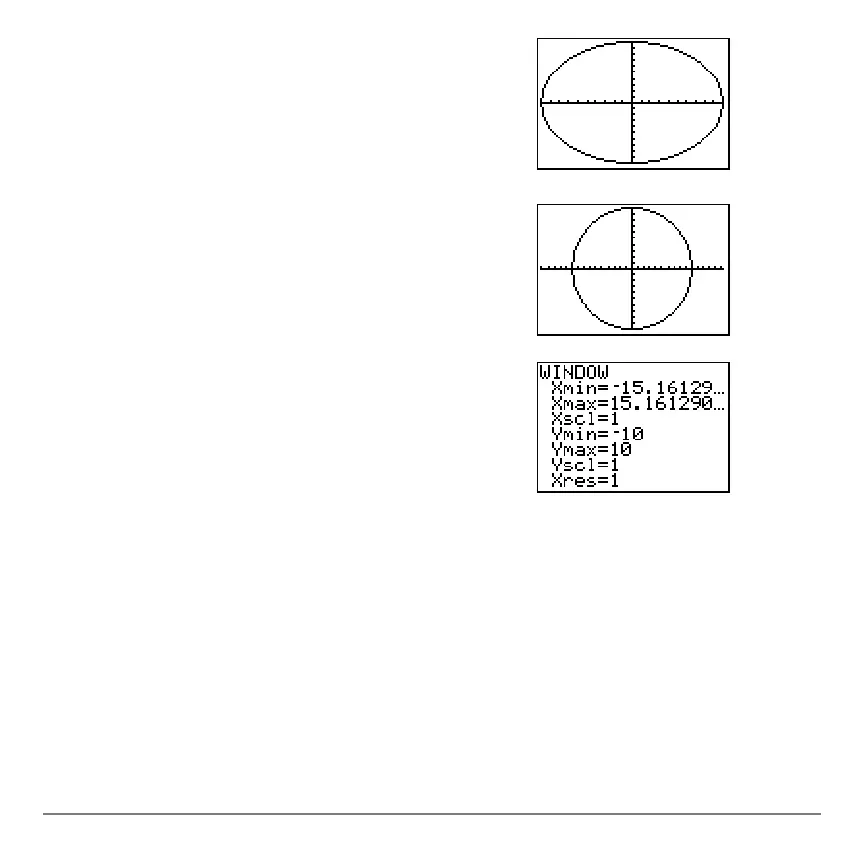
Notice that the functions appear as an ellipse in
the standard viewing window.
3. To adjust the display so that each pixel represents
an equal width and height, press q
5 to select
5:ZSquare. The functions are replotted and now
appear as a circle on the display.
4. To see the
ZSquare window variables, press
p and notice the new values for
Xmin, Xmax,
Ymin, and Ymax.

 Loading...


