Chapter 6: Sequence Graphing 171
3. Press p and set the variables as shown below.
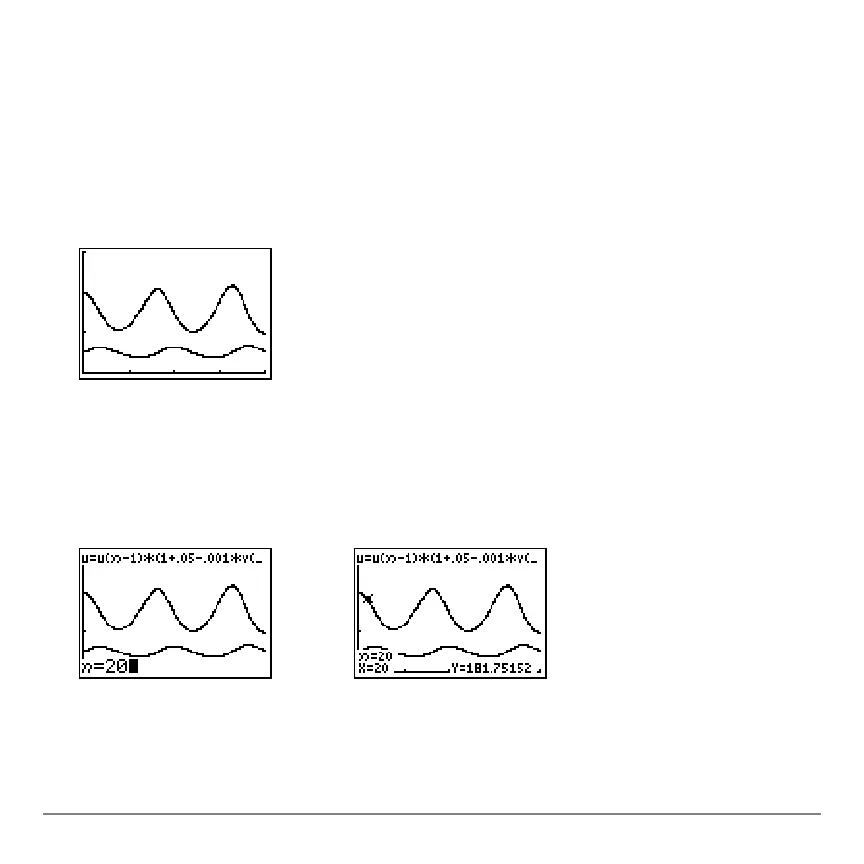
4. Press s to graph the sequence.
5. Press r ~ to individually trace the number of rabbits (
u(n)) and foxes (v(n)) over
time (
n).
Note: Press a number, and then press Í to jump to a specific n value (month)
while in TRACE.
6. Press y . ~ ~ Í to select
uv axes format.
nMin=0
nMax=400
PlotStart=1
PlotStep=1
Xmin=0
Xmax=400
Xscl=100
Ymin=0
Ymax=300
Yscl=100
 Loading...


