Chapter 12: Statistics 275
6. Press o to display the Y= editor.
If necessary, press ‘ to clear the function
Y1.
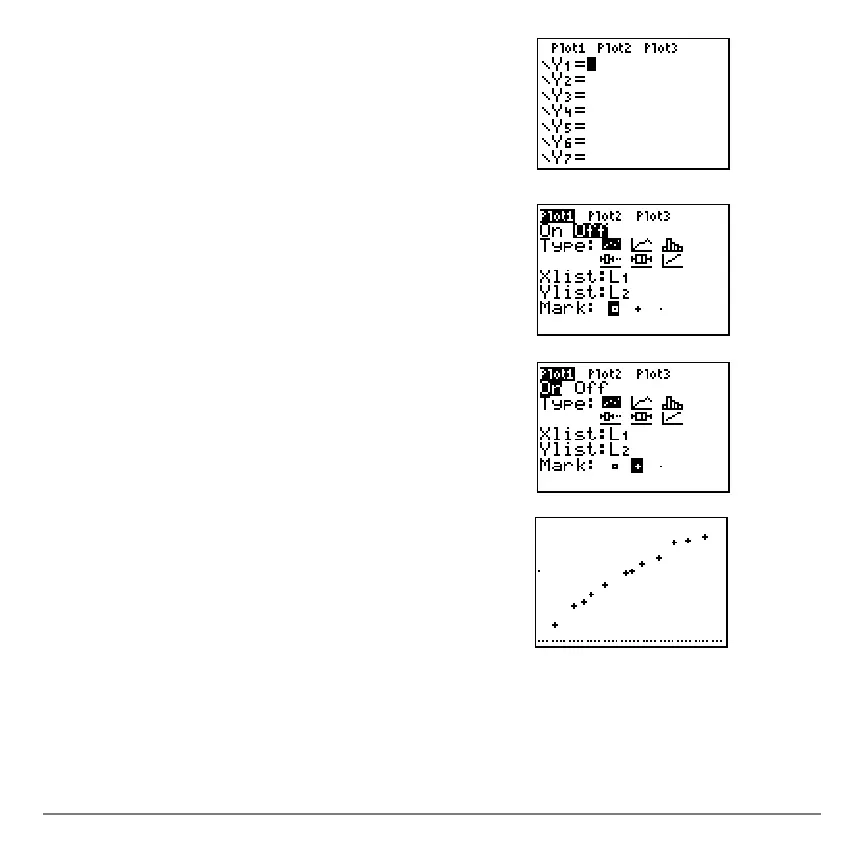
As necessary, press }, Í, and ~ to turn off
Plot1, Plot2, and Plot3 from the top line of the
Y= editor (Chapter 3). As necessary, press †, |,
and Í to deselect functions.
7. Press y ,
1 to select 1:Plot1 from the
STAT PLOTS menu. The stat plot editor is
displayed for plot 1.
8. Press Í to select
On, which turns on plot 1.
Press †Í to select " (scatter plot). Press
†yd to specify
Xlist:L1 for plot 1. Press
†ye to specify
Ylist:L2 for plot 1. Press
†~Í to select
+ as the Mark for each data
point on the scatter plot.
9. Press q
9 to select 9:ZoomStat from the ZOOM
menu. The window variables are adjusted
automatically, and plot 1 is displayed. This is a
scatter plot of the time-versus-length data.

 Loading...


