Chapter 12: Statistics 327
To define a stat plot from a program, begin on a blank line in the program editor and
enter data into one or more lists; then, follow these steps.
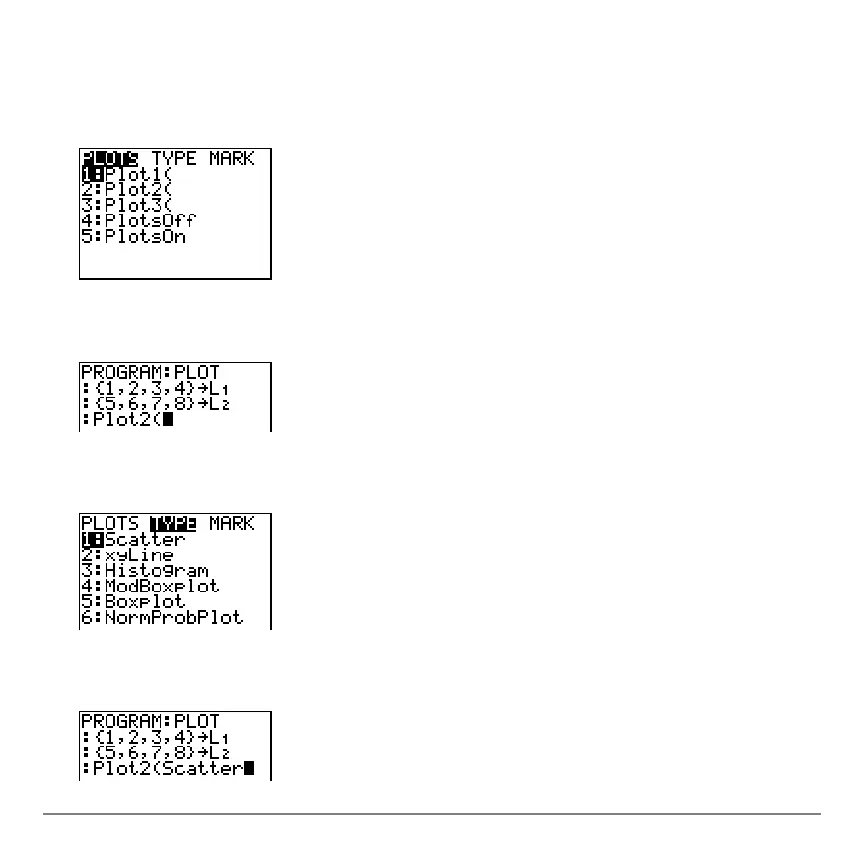
1. Press y , to display the
STAT PLOTS menu.
2. Select the plot to define, which pastes
Plot1(, Plot2(, or Plot3( to the cursor location.
3. Press y , ~ to display the
STAT TYPE menu.
4. Select the type of plot, which pastes the name of the plot type to the cursor location.

 Loading...


