EasyManuals Logo
Home>Texas Instruments>Calculator>TI-84 Plus

Texas Instruments TI-84 Plus Guide Book

Texas Instruments TI-84 Plus
696 pages
To Next Page IconTo Next Page
To Previous Page IconTo Previous Page
Page #511 background imageLoading...
Page #511 background image
Chapter 17: Activities 508
Now graph the equation to see visually how the area changes as the number of sides
gets large.
8. Press z. Select the default mode settings.
9. Press p. Set the viewing window.
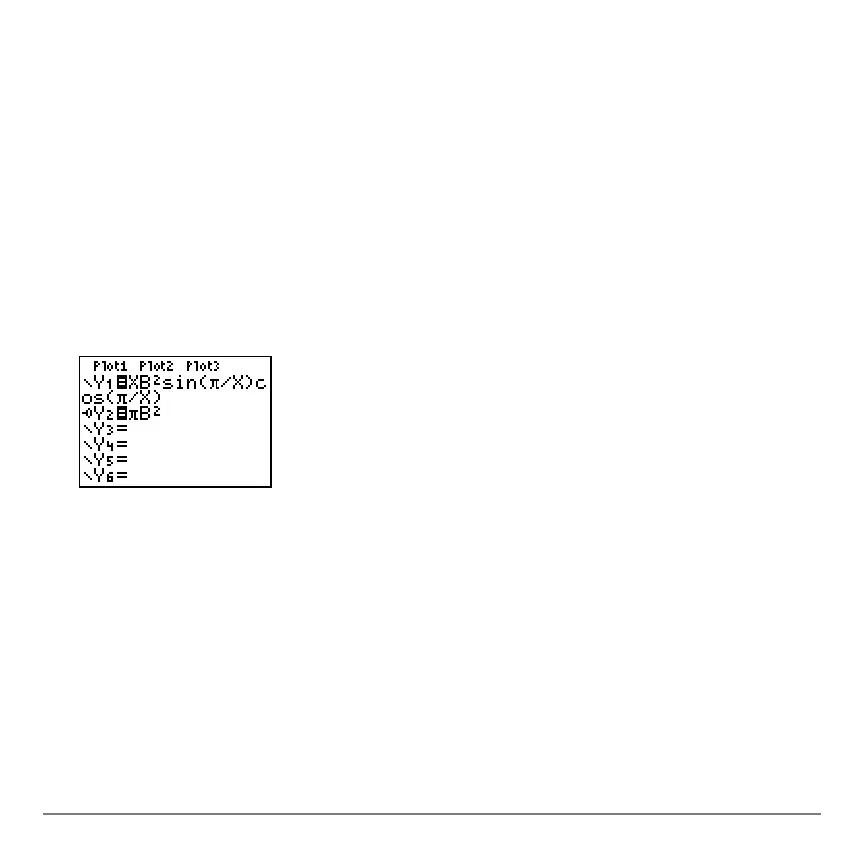
10. Press o. Turn off all functions and stat plots. Enter the equation for the area. Use
X
in place of
N. Set the graph styles as shown.
11. Press r. After the graph is plotted, press
100 Í to trace to X=100. Press 150
Í. Press
188 Í. Notice that as X increases, the value of Y converges to p6
2
,
which is approximately 113.097.
Y2=pB
2
(the area of the circle) is a horizontal
Xmin=0
Xmax=200
Xscl=10
Ymin=0
Ymax=150
Yscl=10
Xres=1

Table of Contents

Other manuals for Texas Instruments TI-84 Plus

Questions and Answers:

Question and Answer IconNeed help?

Do you have a question about the Texas Instruments TI-84 Plus and is the answer not in the manual?

Texas Instruments TI-84 Plus Specifications

General IconGeneral
Battery typeAAA
Power sourceBattery
Number of batteries supported4
TypeGraphing
CoverNo
Form factorPocket
Control typeButtons
Product colorBlack
USB portYes
USB 2.0 ports quantity1
Digits- digits
Display number of lines8 lines
Display number of characters16
RAM capacity0.024 MB
ROM capacity0.480 MB
Storage media type-

Related product manuals