DISPLAYING DATA
iKon-L SECTION 6
Page 117
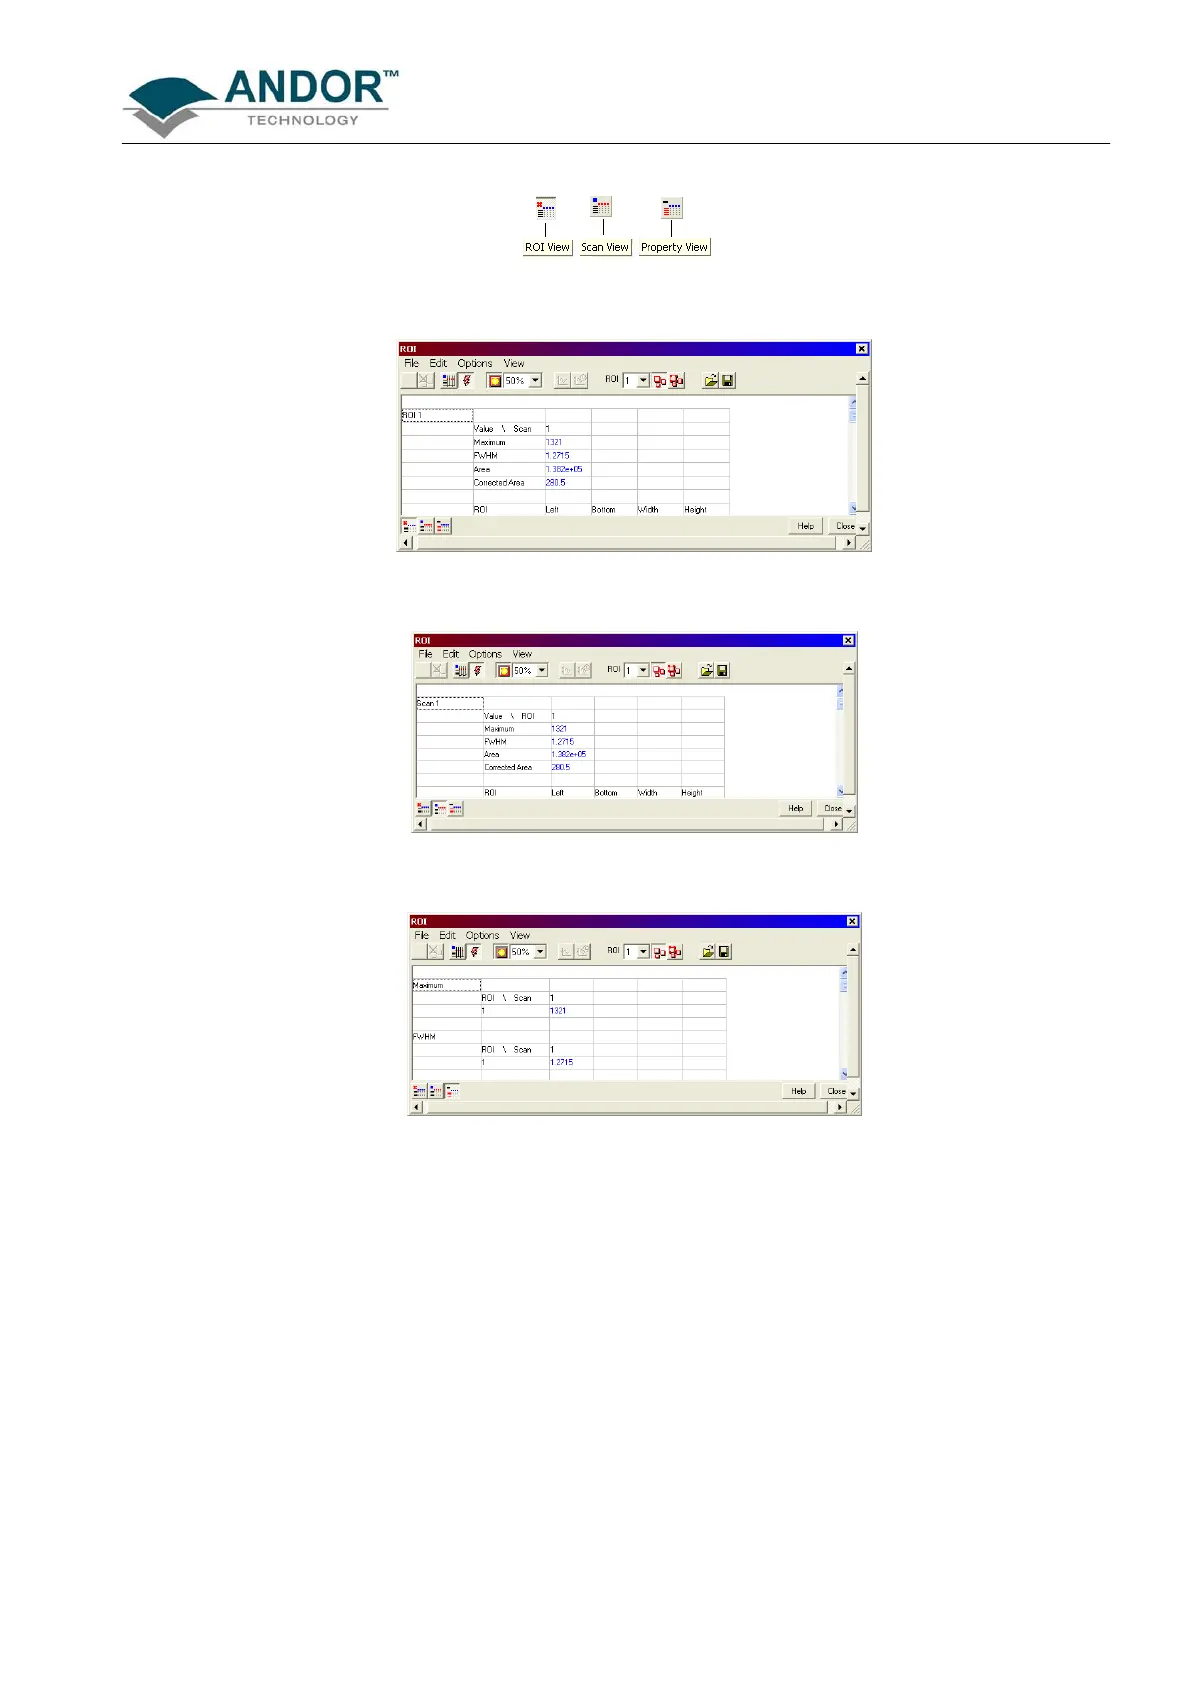
There are 3x buttons in the bottom-left of the ROI dialog box:
Clicking the View button will present and group your ROI data, according to each individual ROI region selected
on the image. It will also display the pixel co-ordinates of the ROI(s) for that scan, e.g.:
Clicking the Scan button will present and group your ROI data, according to individual data scans. It will also
display the pixel co-ordinates for the ROI(s) for that scan, e.g.:
Clicking the Property View button will present and group your ROI data, according to value regions, i.e. Mean,
Range and Standard Deviation. It will also display the pixel co-ordinates for the ROI(s) for that scan, e.g.:
 Loading...