Chapter 2: BD FACStation Software 29
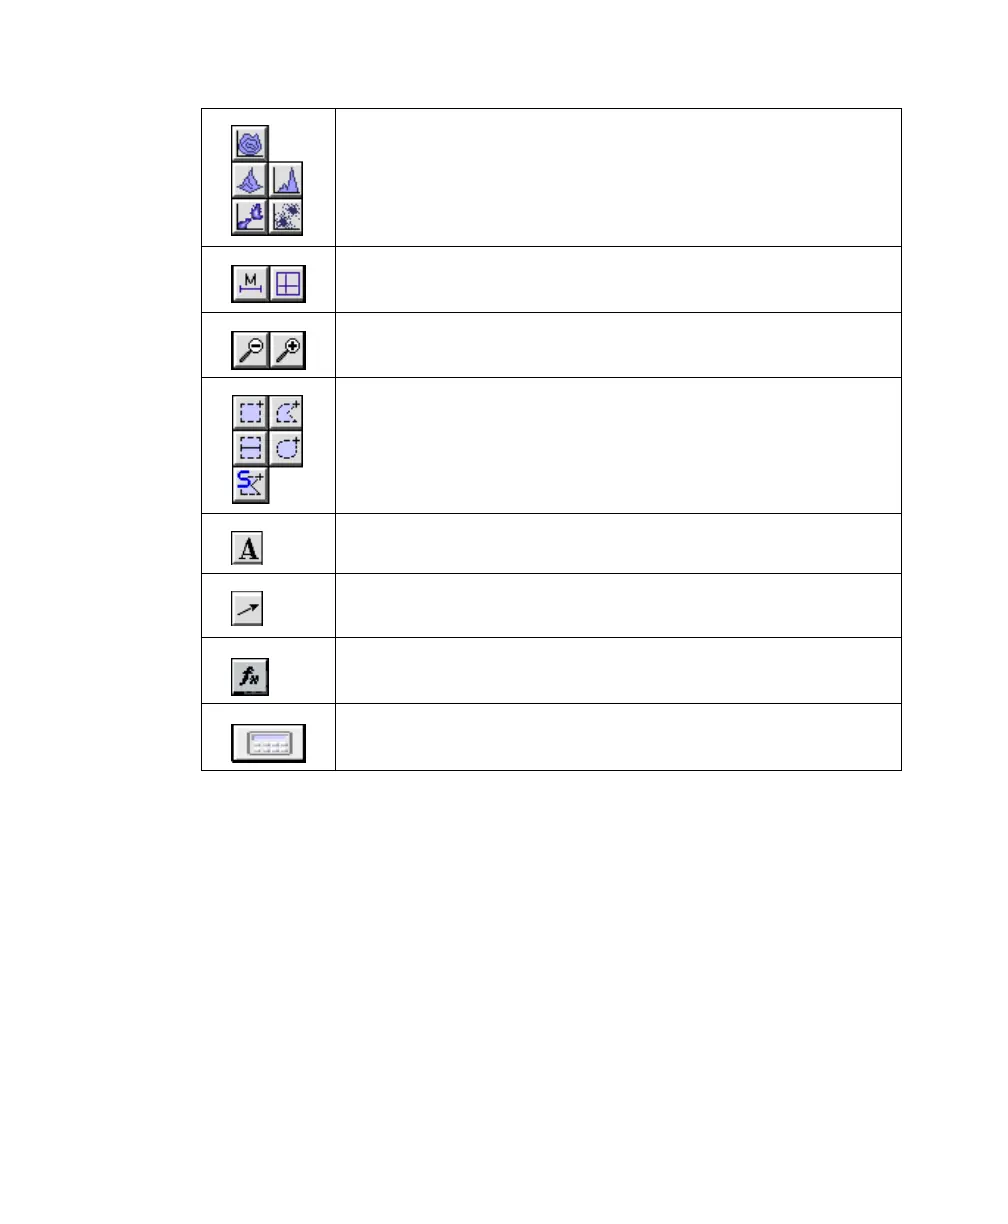
Plot tools—create contour (C), 3-dimensional (3D), density
(D), histogram (H), or dot (d) plots
To create a plot, select a tool, click in the Experiment
document window, and drag to set the plot size.
Marker tools—select a range of data on a histogram plot (H)
or divide a dot, density, or contour plot into quadrants (Q)
Zoom tools—magnify an area of a plot (+) or return the plot to
its original size (–)
Region tools—create rectangular (R), polygonal (P), elliptical
(E), or Snap-To (S) regions on dot, density, or contour plots, or
create histogram (H) regions on a histogram plot (histogram
regions are used for gates; histogram markers are used for
statistics)
Text tool—create or edit free text
Arrow tool—draw arrows, starting from an empty area of the
Experiment document
Expression Editor tool—create mathematical expressions using
statistical results
Calculator tool—recalculate data when Auto Recalculate
(Gates menu) is turned off
C
3D
D
H
d
HQ
R
H
P
E
S