Chapter 5: Running Samples Manually 113
Analyzing Data
During analysis, acquired data from FCS data files is displayed in appropriate
plots. Use regions and gates to restrict the analysis to populations of interest.
BD CellQuest Pro software analyzes the data and calculates statistics that you
can print or export.
The following sections demonstrate analysis features using sample data in the
BD Applications > BD CellQuest Pro folder. The Sample Files folder contains 12
data files from 3 samples. Each sample was stained with the following 4-tube
reagent panel:
Creating an Analysis Document
1 Launch BD CellQuest Pro software, if necessary.
If the software is already running, select File > New Document.
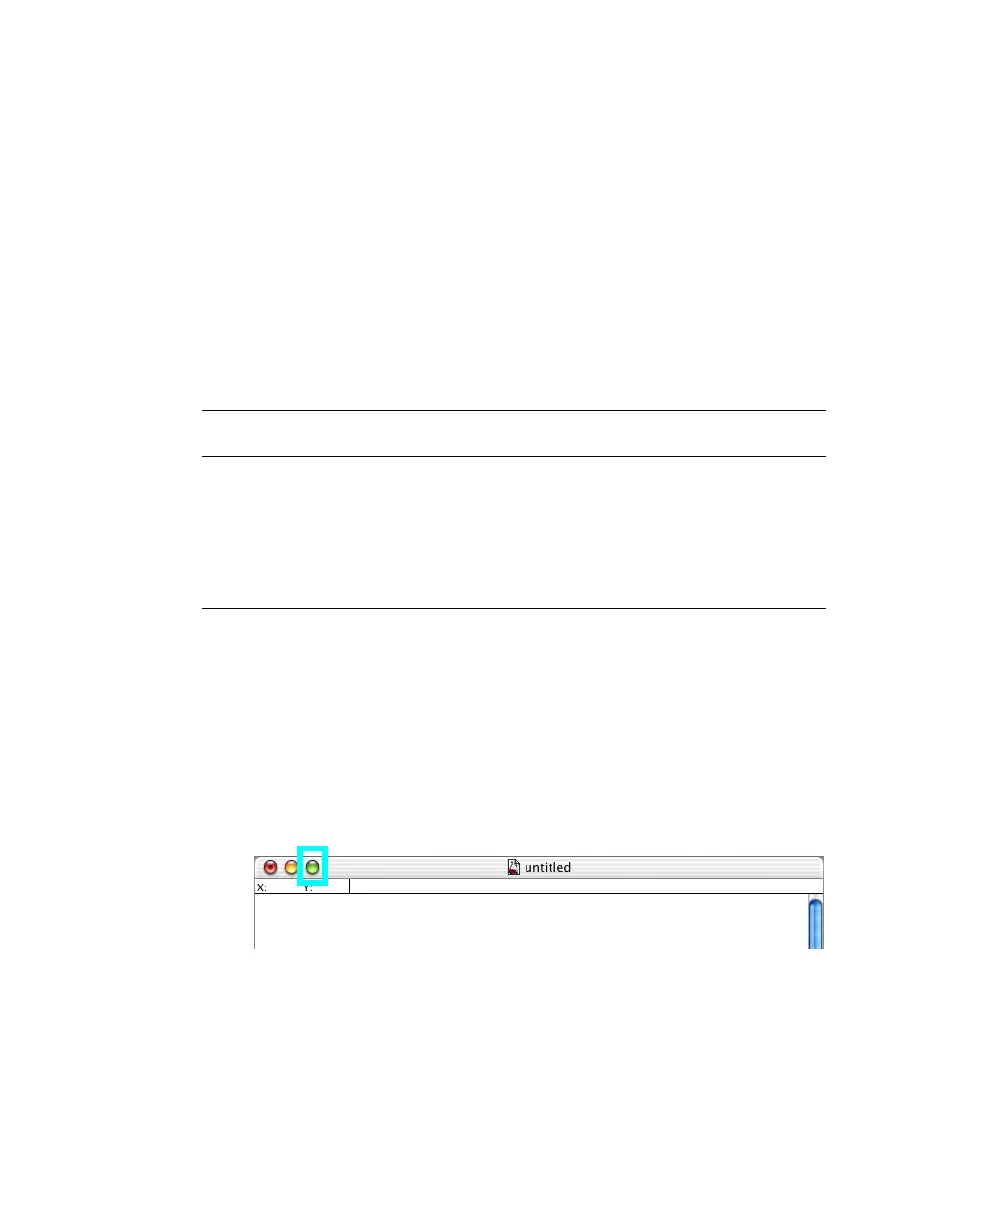
2 Click the zoom button to expand the Experiment document window:
3 (Optional) Increase the number of Experiment document pages.
• Choose File > Document Size.
Tube Sample 1 Sample 2 Sample 3
Tube 1: γ
1
FITC/γ
2a
PE NORM001 NORM005 NORM009
Tube 2: CD3 FITC/CD19 PE NORM002 NORM006 NORM010
Tube 3: CD3 FITC/CD4 PE NORM003 NORM007 NORM011
Tube 4: CD3 FITC/CD8 PE NORM004 NORM008 NORM012