114 BD FACSCalibur Instructions for Use
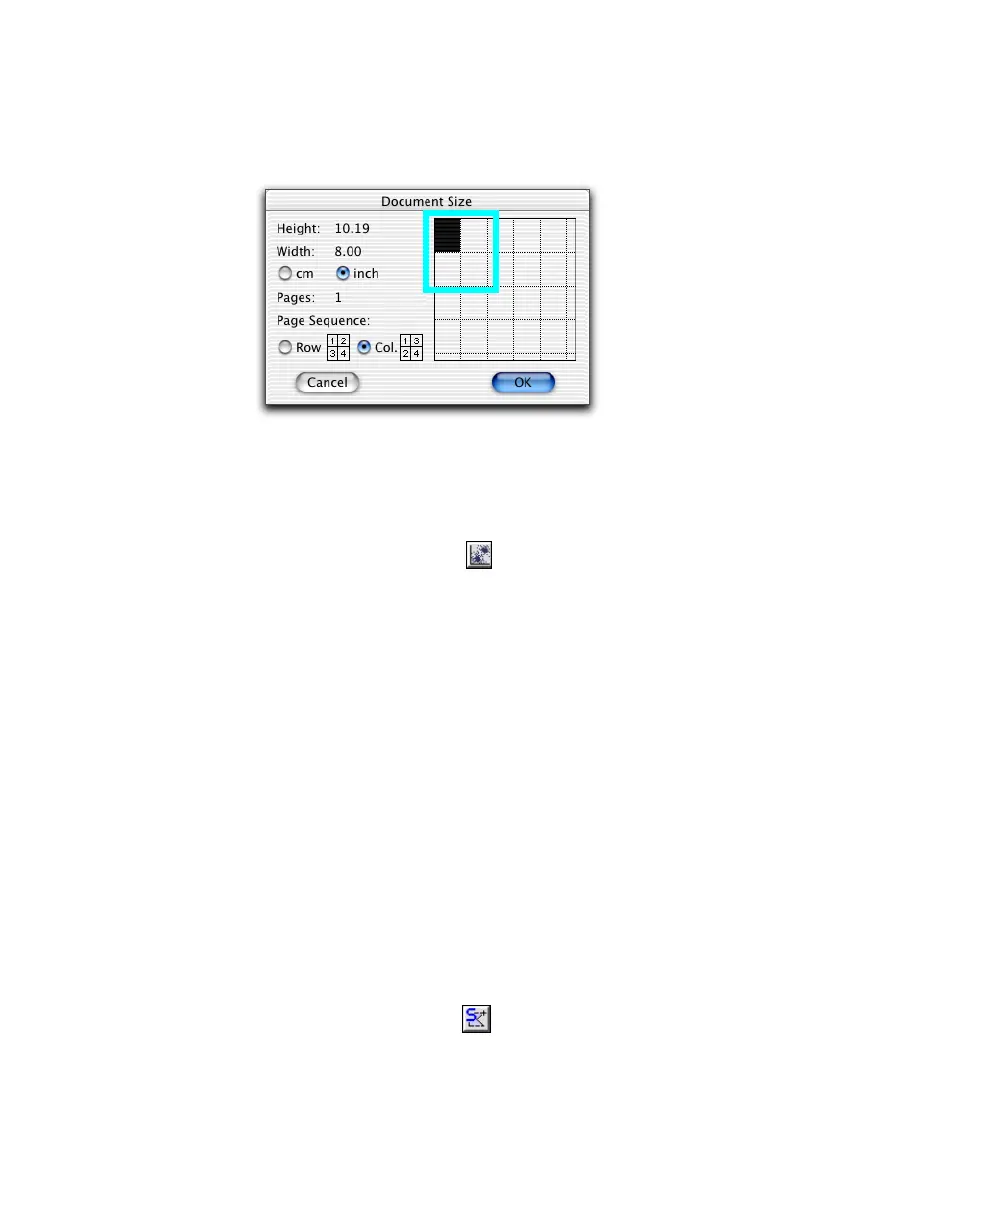
• Click rectangles to add additional pages (each rectangle represents one
page).
; Tip Change page units or the print sequence using options in the dialog.
4 Create an Analysis dot plot.
• Select the Dot Plot tool ( ), click in the Experiment document
window, and drag to set the plot size.
• Click the File pop-up control, and choose Select File.
• Navigate to BD Applications > BD CellQuest Pro > Sample Files, and
double-click NORM001.
The plot shows data from the selected file.
• (Optional) Click the Event Color box and change the event color
(Figure 5-3).
NOTICE To display FCS data files, you must first create a plot and then
choose Select File in the Inspector. You cannot view an FCS data file by
double-clicking its icon.
5 Create a region around the lymphocytes in the dot plot.
; Tip Use the Snap-To tool ( ) to draw a quick and simple region. Select
the tool, and click the lymphocyte population. A gate is automatically
drawn.