Chapter 5: Running Samples Manually 115
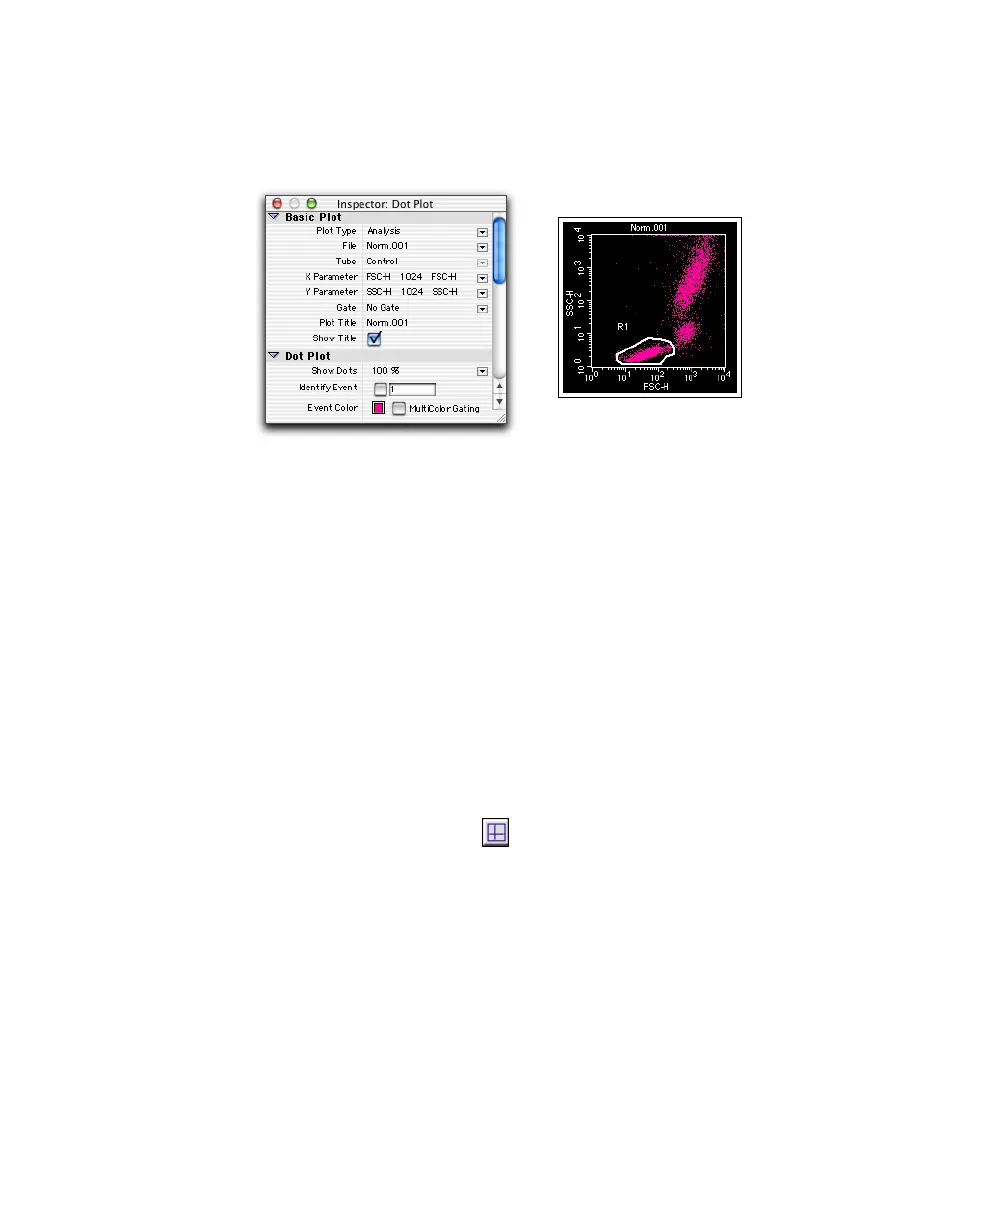
Your dot plot and Inspector should look similar to Figure 5-3.
Figure 5-3 Analysis dot plot with Snap-To lymphocyte region
6 Create an Analysis FL1 vs FL2 contour plot showing lymphocyte-gated
data from NORM001.
• Choose Plots > Contour Plot. (This creates a plot the same size as the
dot plot.)
• In the Contour Plot Inspector, click the File pop-up control, and choose
NORM001.
• Choose FL1-H for the X Parameter, and FL2-H for the Y Parameter.
• Choose G1 = R1 for the Gate.
• (Optional) Click the Color box and choose a new color (Figure 5-4).
7 Create quadrant markers ( ) around the negative population in the
contour plot.
Select the Quadrant Marker tool, and drag to set the intersect point so the
subclass population is in the lower-left quadrant.Your contour plot and
Inspector should look similar to Figure 5-4.