116 BD FACSCalibur Instructions for Use
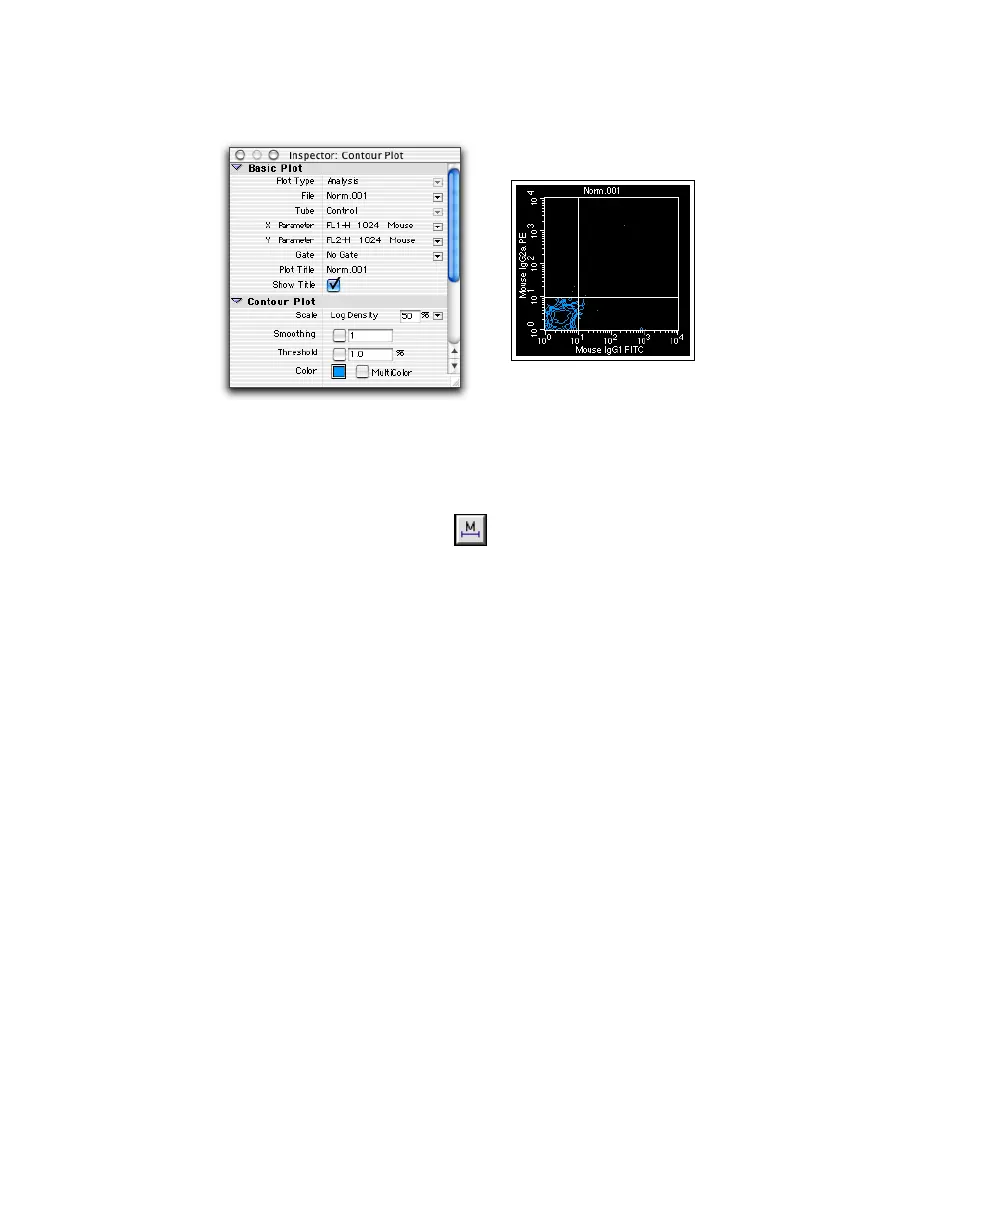
Figure 5-4 Analysis contour plot with quadrant markers
8 Create an Analysis FL1 histogram displaying NORM001 gated data.
(Optional) Change the Line and Fill colors in the Inspector.
9 Draw a histogram marker ( ) around the negative population
(Figure 5-5).
Select the Histogram Marker tool and click to set the left edge of the
marker. Drag to set the right edge of the marker; release the mouse to
complete it.
10 Draw a second histogram marker from the upper boundary of marker 1 to
the end of the histogram plot.
Your histogram plot and Inspector should look similar to Figure 5-5.