Chapter 5: Running Samples Manually 117
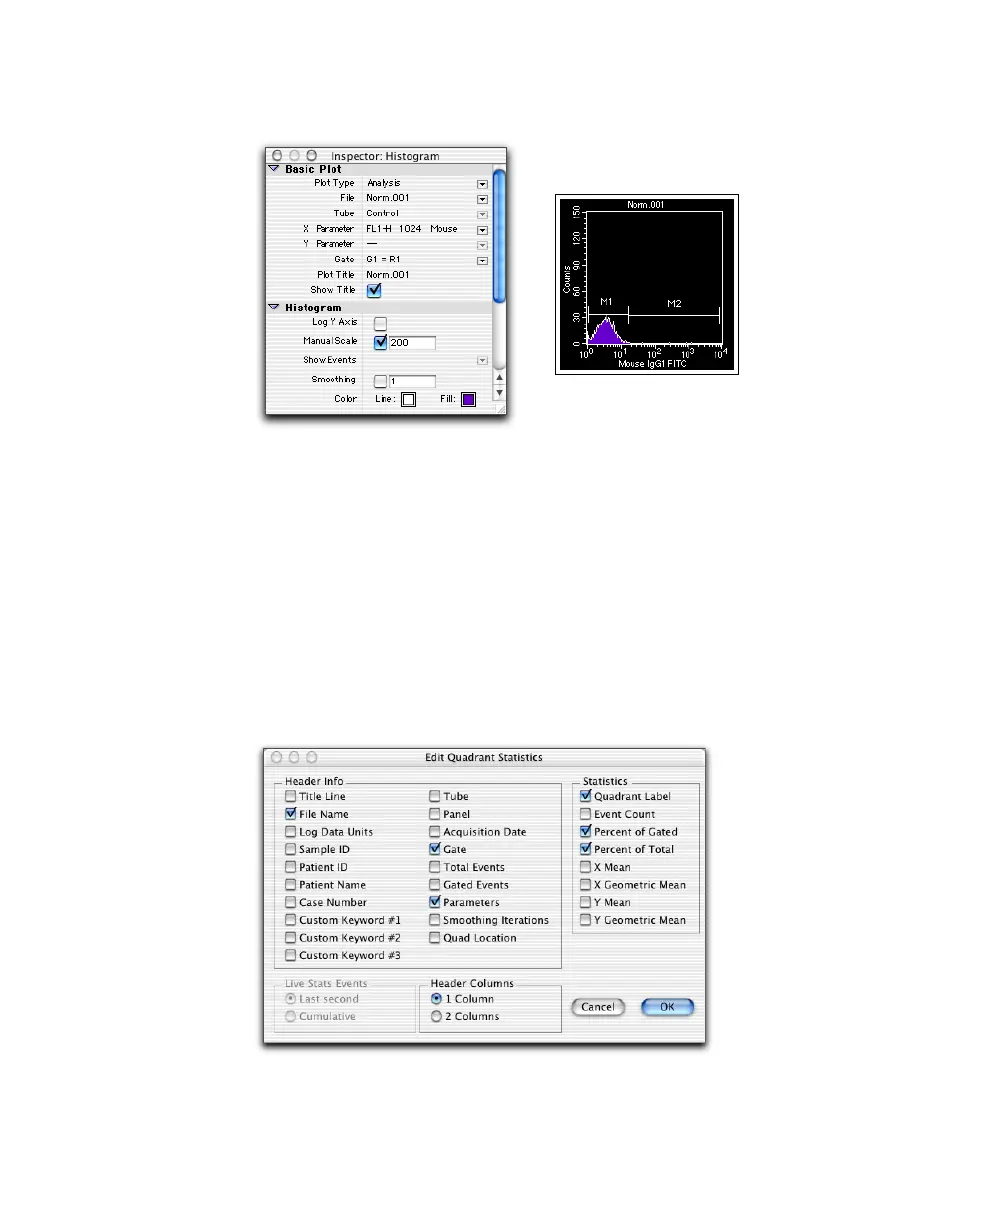
Figure 5-5 Analysis histogram with histogram markers
Displaying Statistics
1 Select the contour plot, and choose Stats > Quadrant Stats.
The Quadrant Statistics view appears showing data from NORM001.
2 Select the Quadrant Statistics view and choose Stats > Edit Quadrant Stats.
3 Deselect all choices except File Name, Gate, Parameters, Quadrant Label,
Percent of Gated, and Percent of Total; select 1 Column for the Header.