Quality Assurance on the BD FocalPoint™ Slide Profiler
187
6 Rescreen all the slides selected in Steps 3, 4, and 5, following your normal laboratory
practices.
When your QC rescreening is complete, retain the printed QC Review Report and Print Summary
Statistics as a record of your QA activities.
19.3 Monitoring the Slide Rejection Rate
This section describes the procedures necessary to ensure that your laboratory is properly
monitoring the performance and results data of the BD FocalPoint™ Slide Profiler.
To do this, you monitor the usage statistics on a monthly basis and calculate the number of slides
rejected by your system as unsuitable for scanning. You use this information to observe any
increase in slide rejections due to specific slide preparation parameters. If the slide rejection rate
is above the acceptable limit, Contact BD Technical Support. BD service personnel will assist you
in evaluating and correcting the cause of the increased slide rejection rate. One means of
evaluating your process is to analyze the mean stain scores on your Usage Statistics report.
19.3.1 Mean Stain Score
With BD FocalPoint™ Slide Profiler software version APPS 1.2.1 and later, the mean stain score
is included in the Usage Statistics report. This score is the average stain score for all of the slides
that have been included in print sets. This information enables better control of the slide
preparation process. By comparing the mean stain score to scores from prior reports and to the
acceptable range (4.0 to 6.8), you will be better equipped to judge whether minor adjustments or
a complete renewal of your slide preparation process is appropriate.
To document the slide rejection rate, use the form provided in Section 26. Make photocopies of
this form as needed.
It is convenient to check the slide rejection rate for the previous month on the first day of a new
month.
To check your slide reject rate:
1 Choose Utilities†Statistics†Usage Statistics to display the Statistics Reports window as
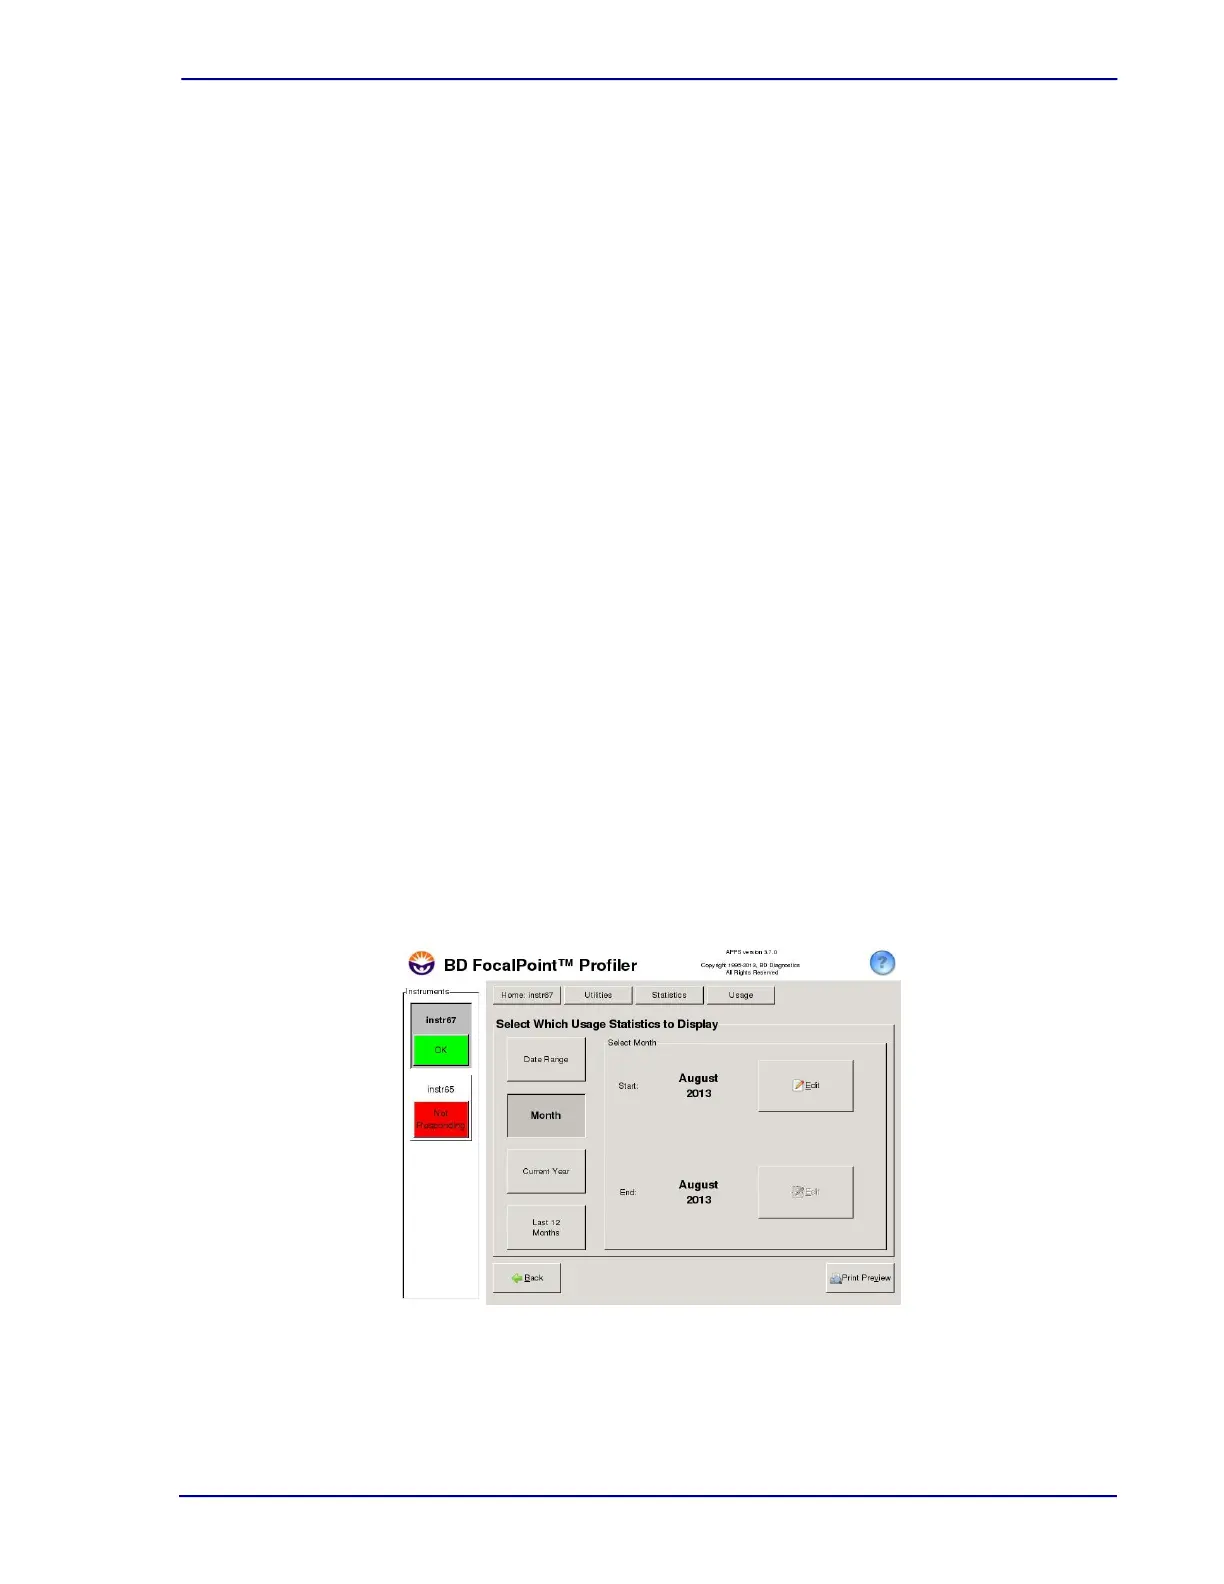
shown in Figure 19-5.
Figure 19-5 – Usage Statistics options
2 Click on the Month button. Click on the Edit buttons and
select the appropriate month and
year.