BD FocalPoint™ GS Imaging System Instrument User’s Manual
188
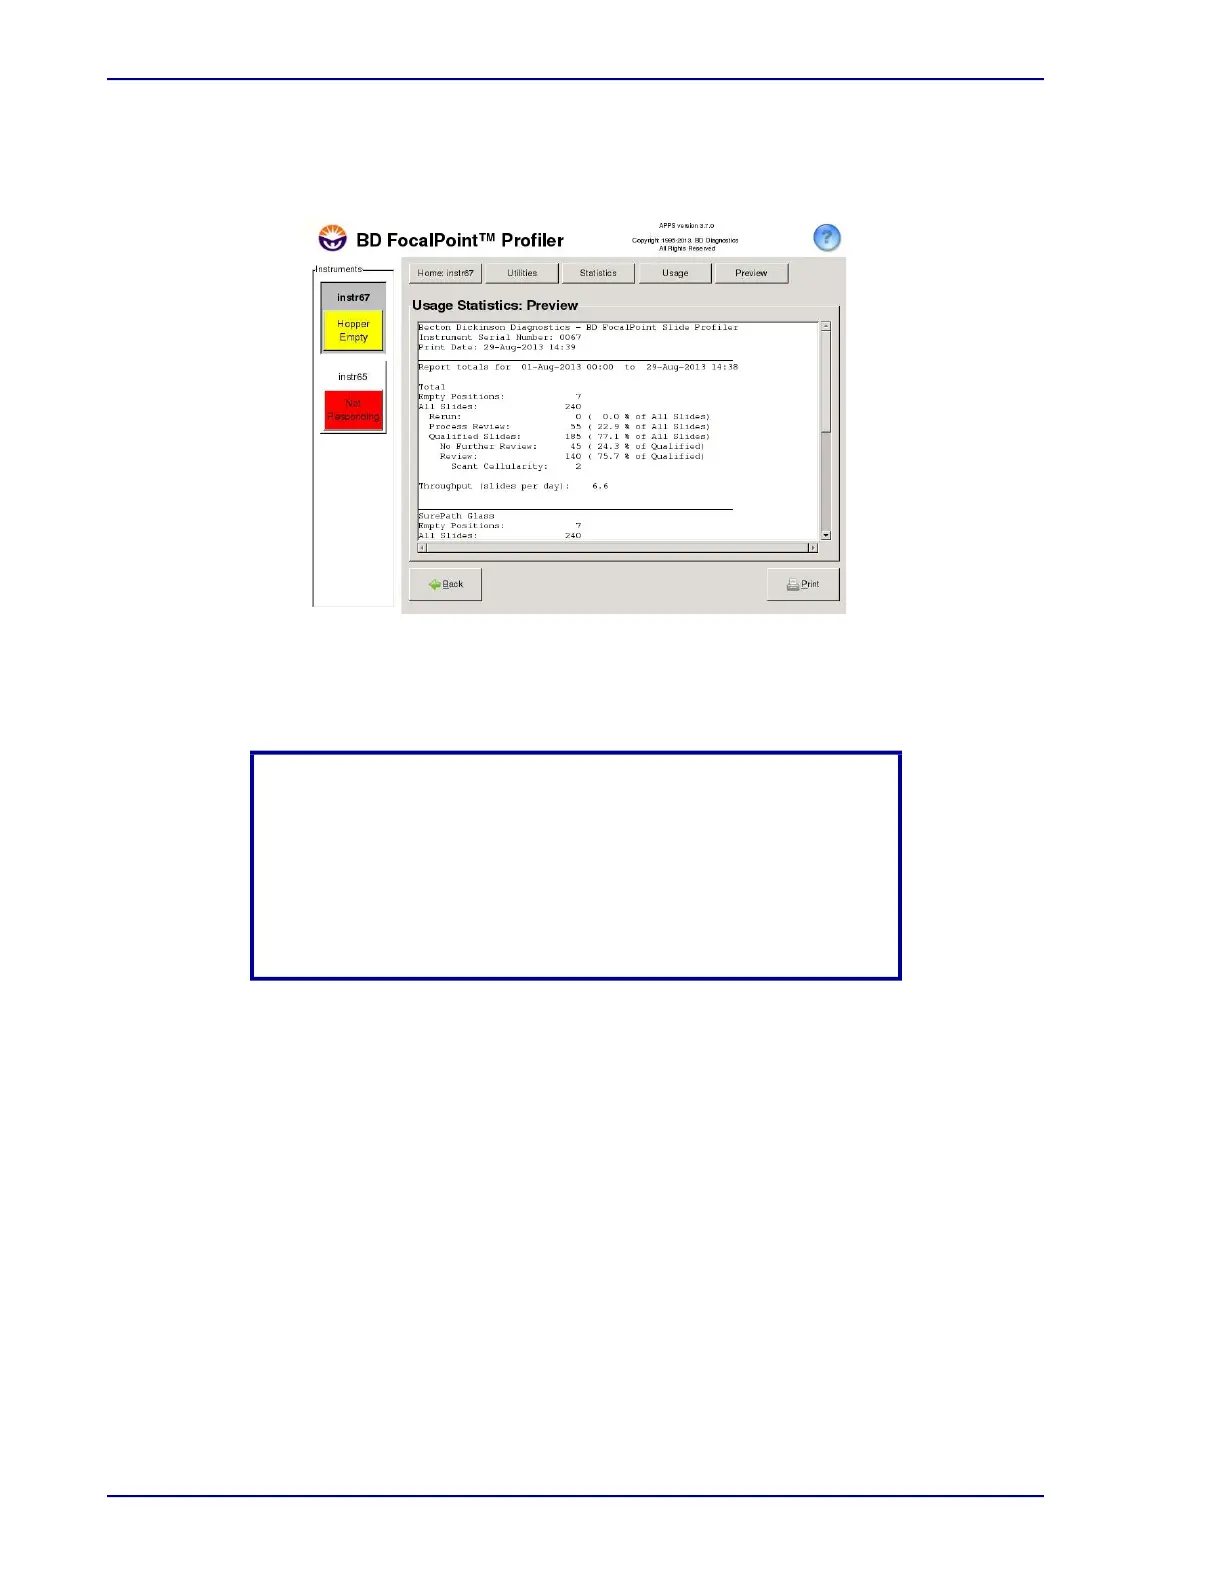
3 Click Preview to display the statistics on your screen. Figure 19-6 shows an example of
usage statistics for the month of August.
Figure 19-6 – Usage Statistics
4 Use the scroll bar, to scroll down and view that statistics for each operating mode.
5 If the Process Review rate value is greater than 10%, print a Process Review report for the
month. Look over the report for trends to determine if there is something you can do to
correct the problem.
6 If analysis of the Process Review report doesn’t suggest any corrective actions, Contact BD
Technical Support. BD may examine the System Logs to determine the cause of the process
failures and advise you on corrective action to reduce the frequency of slide rejections.
NOTE
Slide data is available to be displayed after the slides are printed
and assigned to a print set, not when they complete processing on
the instrument. Additionally, the data is presented on a 24 hour
basis, not per print set. Slides are added to the statistics the day
they are first printed run and assigned to a print set, not when they
complete processing on the instrument.