12-2 SPECTRUM ANALYSIS Biodex Medical Systems, Inc. © 2014
4. Use the left arrow <"> or right arrow <#> above the cursor names to move the
highlighted left, data or right cursor in the appropriate direction. Selecting the double
arrow <""> left moves the cursor 16 channels to the left. Using the double arrow right
<##> moves the selected cursor 16 channels to the right. The up <!> arrow will find the
peak for the data channel in the ROI. The <data> channel can also be set on any single
channel. The counts in the ROI are displayed on the right side of the screen as counts and
also displayed as cpm.
5. The center box under the spectrum is used to select an ROI from the preset isotopes. This
box contains up <!>, down arrow <$> and an <isotope> button. The <isotope> button
displays the isotope list and you can select an isotope that you want to display the ROI. To
save a displayed ROI, press the <save ROI> button. To move up/down one isotope at a
time in the list, you can press the up arrow <!> or down arrow <$> next to the <isotope>
button. The up/down arrows will move up/down the isotope list one isotope at a time. To
undo a saved ROI, select the <undo> button. The <undo> button will remove the last ROI
saved.
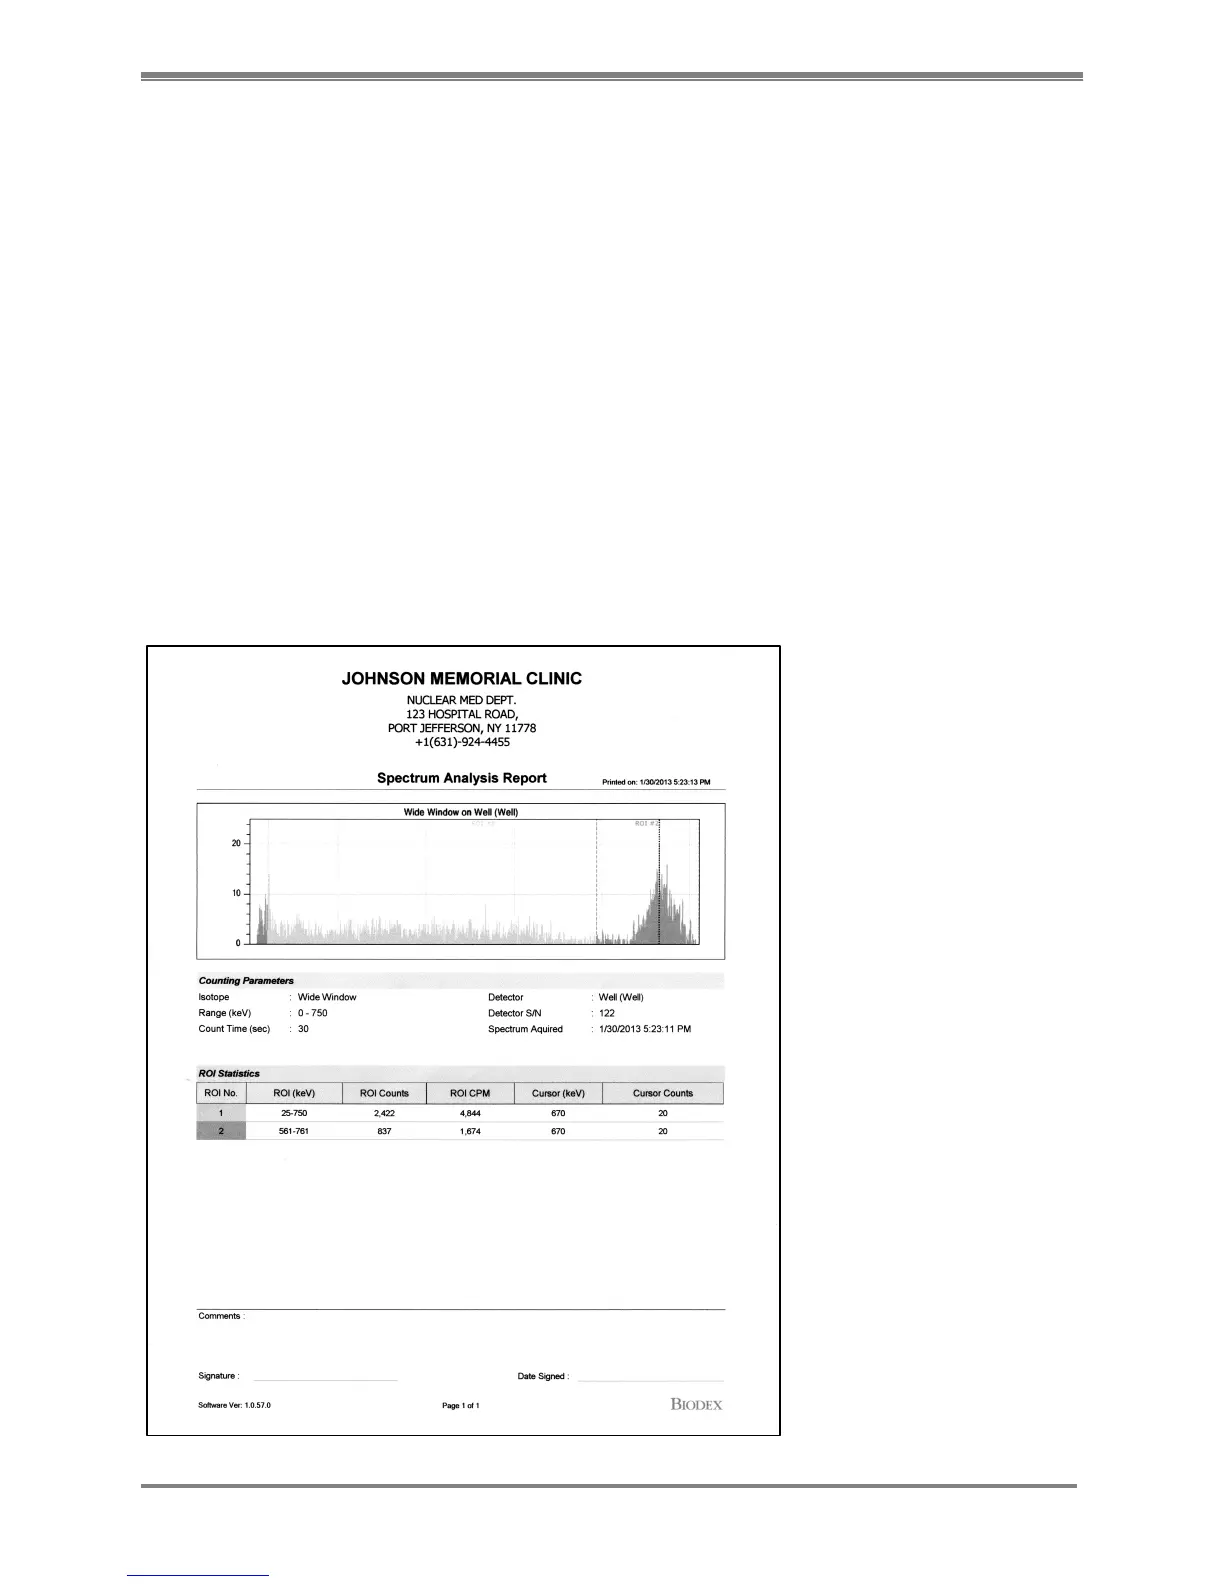
6. To print the spectrum that you have with the selected ROI’s, select the <printer> icon
which will display the report. Select <printer> icon and the report will print.
7. Select <cancel> to return to the counting screen you came from and proceed with the
procedure you were working on.
Figure 12.2. Spectrum Analysis Report.