12. Spectrum Analysis
Spectrum Analysis is available throughout the system after you perform a measurement.
Spectrum Analysis allows you to analyze the Isotope Spectrum counted by setting various
Regions of Interest. You can determine contaminates in the spectrum by analyzing the
spectrum and determining the energy of an unknown peak.
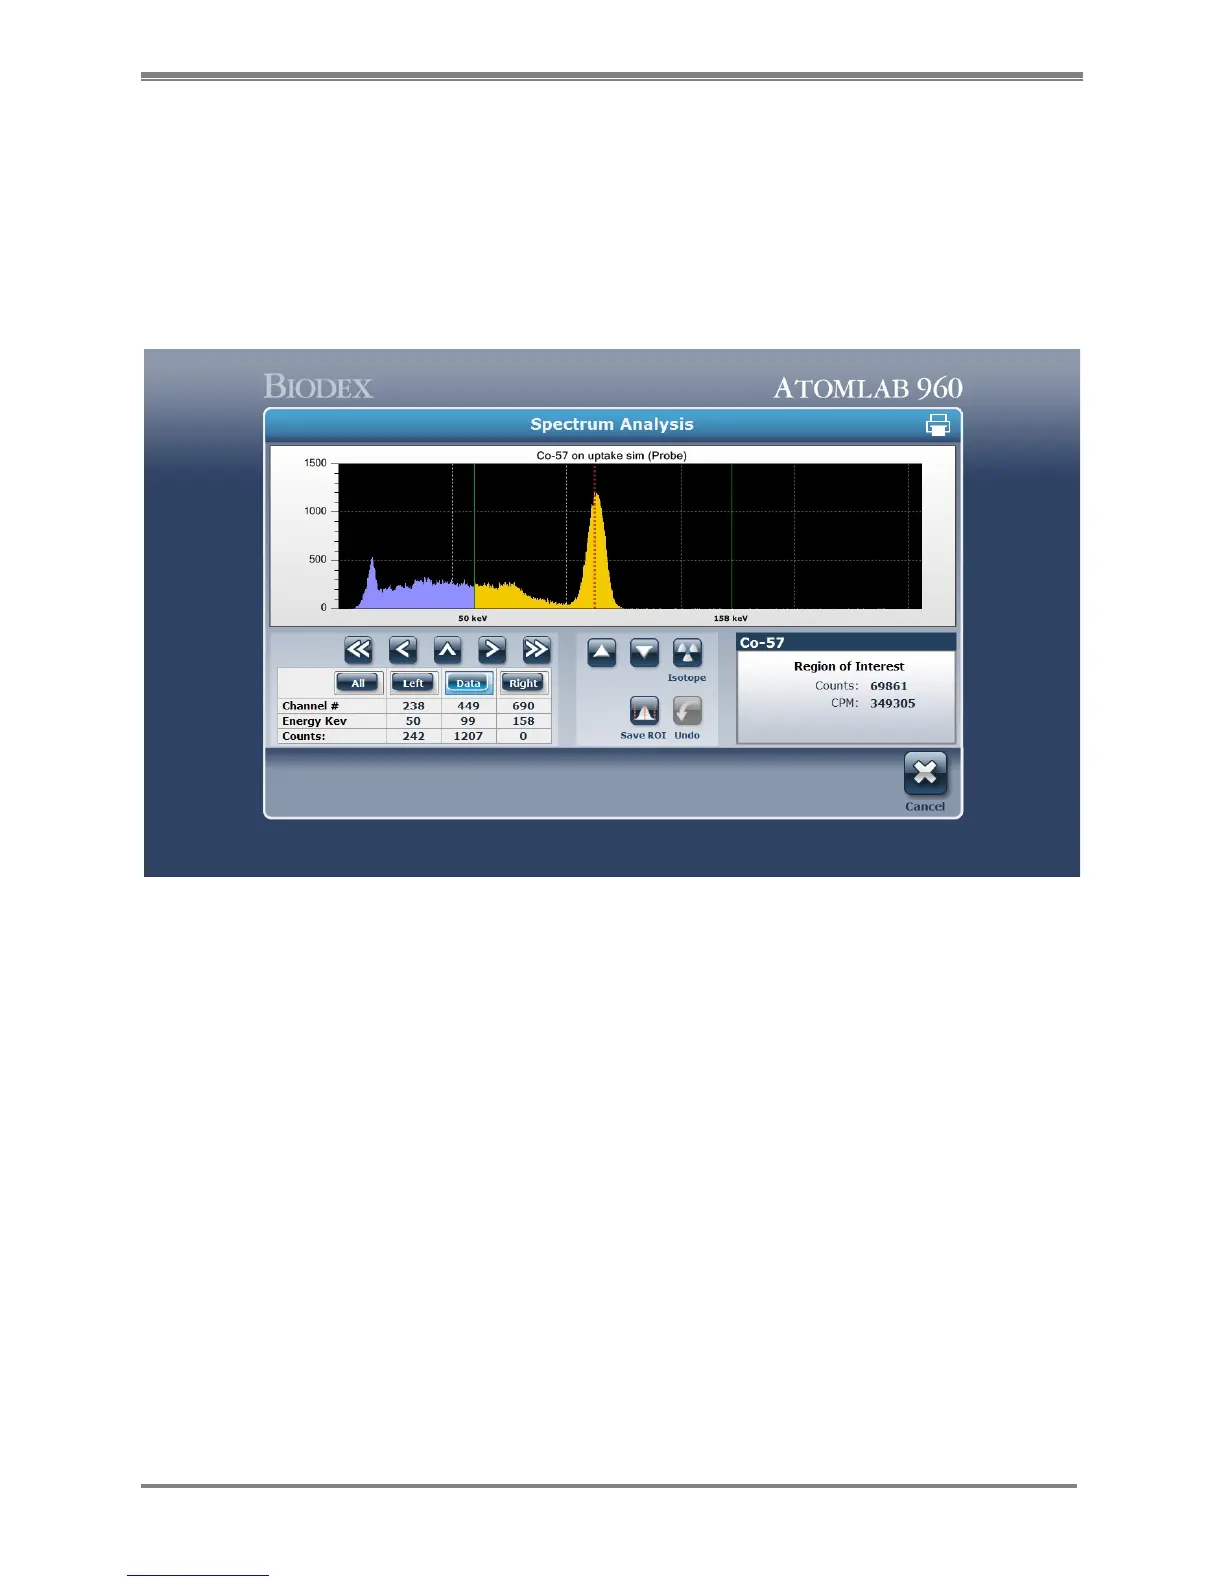
Figure 12.1. The Spectrum Analysis screen.
1. Spectrum Analysis is available following any measurement performed with the system.
Select the <Analysis> icon located on the bottom of the counting screen when the count is
complete. This opens the Spectrum Analysis screen.
2. The Spectrum from the count just performed is shown with the spectrum data. The
Spectrum Analysis screen shows the Region of Interest (ROI) for the isotope counted under
the spectrum. The preset ROI window is displayed along the bottom of the spectrum. The
detector and isotope used is displayed above the spectrum. The box at the lower left
shows details for the spectrum. The <left> button controls the left ROI cursor. The
<right> button controls the right ROI cursor. The <data> cursor is a single channel that
you can set or when in the ROI if you press <!> arrow it moves the cursor to the peak
within the ROI. These three cursors display the channel number, energy in KeV, and the
counts for the specific channel.
3. To move any ROI cursor, select the <left>, <data> or <right> cursor and then select the
spectrum screen where you want the cursor.