Manual Operation
(c) (d)
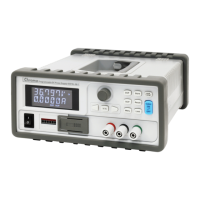
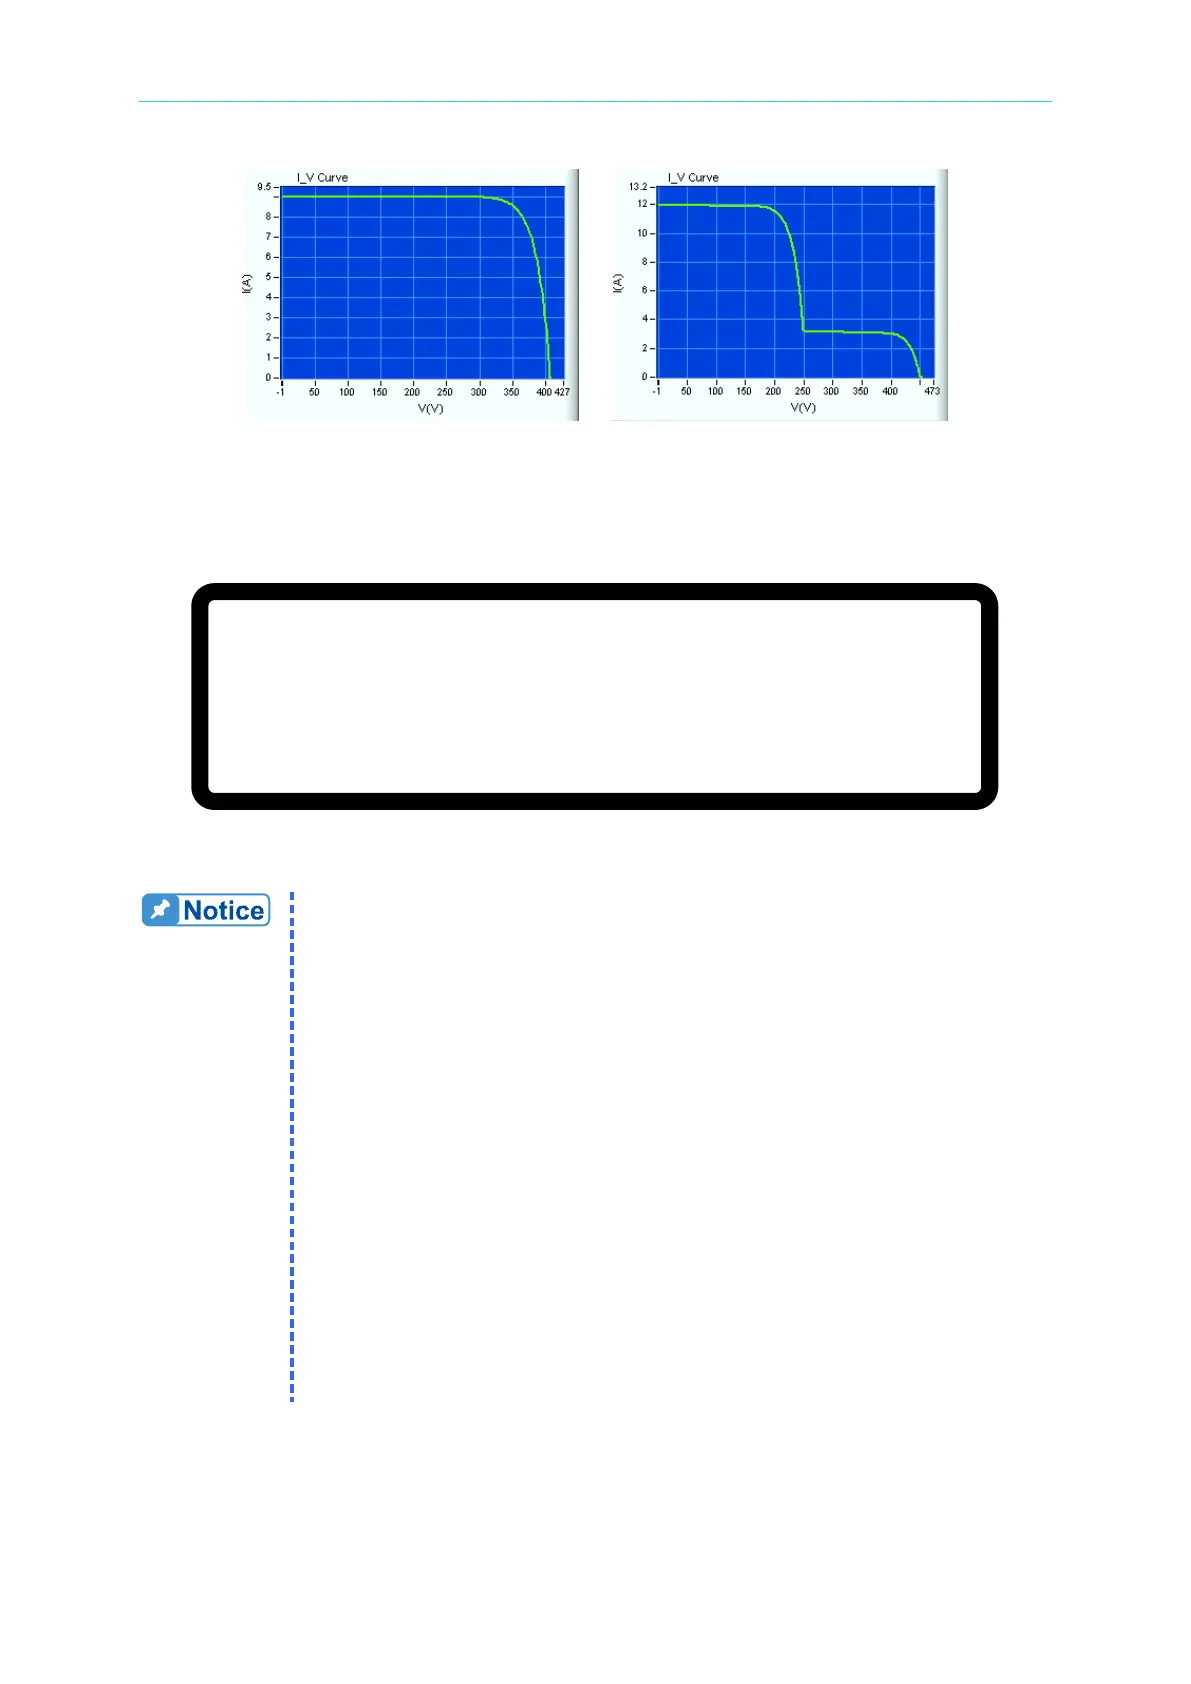
Figure 3-158
Figure 3-159 shows the screen display when using the Solar Array Simulation Soft Panel. The
settings cannot be changed from the front panel.
V O C
=
1 0 0
.
0 0
V
_
I S C
=
1 0 .
0 0 0 A O N
V M P
=
6 0 .
0 0 V I M P
= 6
.
0 0 0 A
9 9 .
9 9 9
V
0 .
0 2 9 8
A
3 .
0
W
Figure 3-159
To create an IV Curve in Excel, perform the following steps:
1. Open a blank worksheet.
2. The first column in the worksheet is voltage and the second column is
current.
3. The first row in the worksheet is the first dot of the IV Curve. A
maximum of 128 dots (rows) can be plotted per curve. The curve can
be less than 128 dots but must be greater than 3 dots with duplicates.
4. The voltage and current of an IV Curve must be in reverse order, i.e.,
when the voltage is increasing the current must be decreasing and
vice versa.
5. The first voltage dot must be zero or the maximum value and the
current must be the opposite. If the voltage is zero, the current must be
the maximum current. The maximum voltage is the open voltage (Voc)
of the Solar Cell and the maximum current is the short circuit current
(Isc) of the cell.
6. Figure 3-160 shows 10 dots of data to create an IV curve. Column A is
voltage and column B is current, while rows 1-10 are the data points.