Graphic view .(“5.1.2.1.3.1.1. Graphic view”)
Tariff selection (“5.1.2.1.3.1.2. Tariff selection.”)
Back, returns to the demand parameters display screen, Figure 59.
Main Menu, back to the main menu, Figure 25.
5.1.2.1.3.1.1.-
Graphic view.
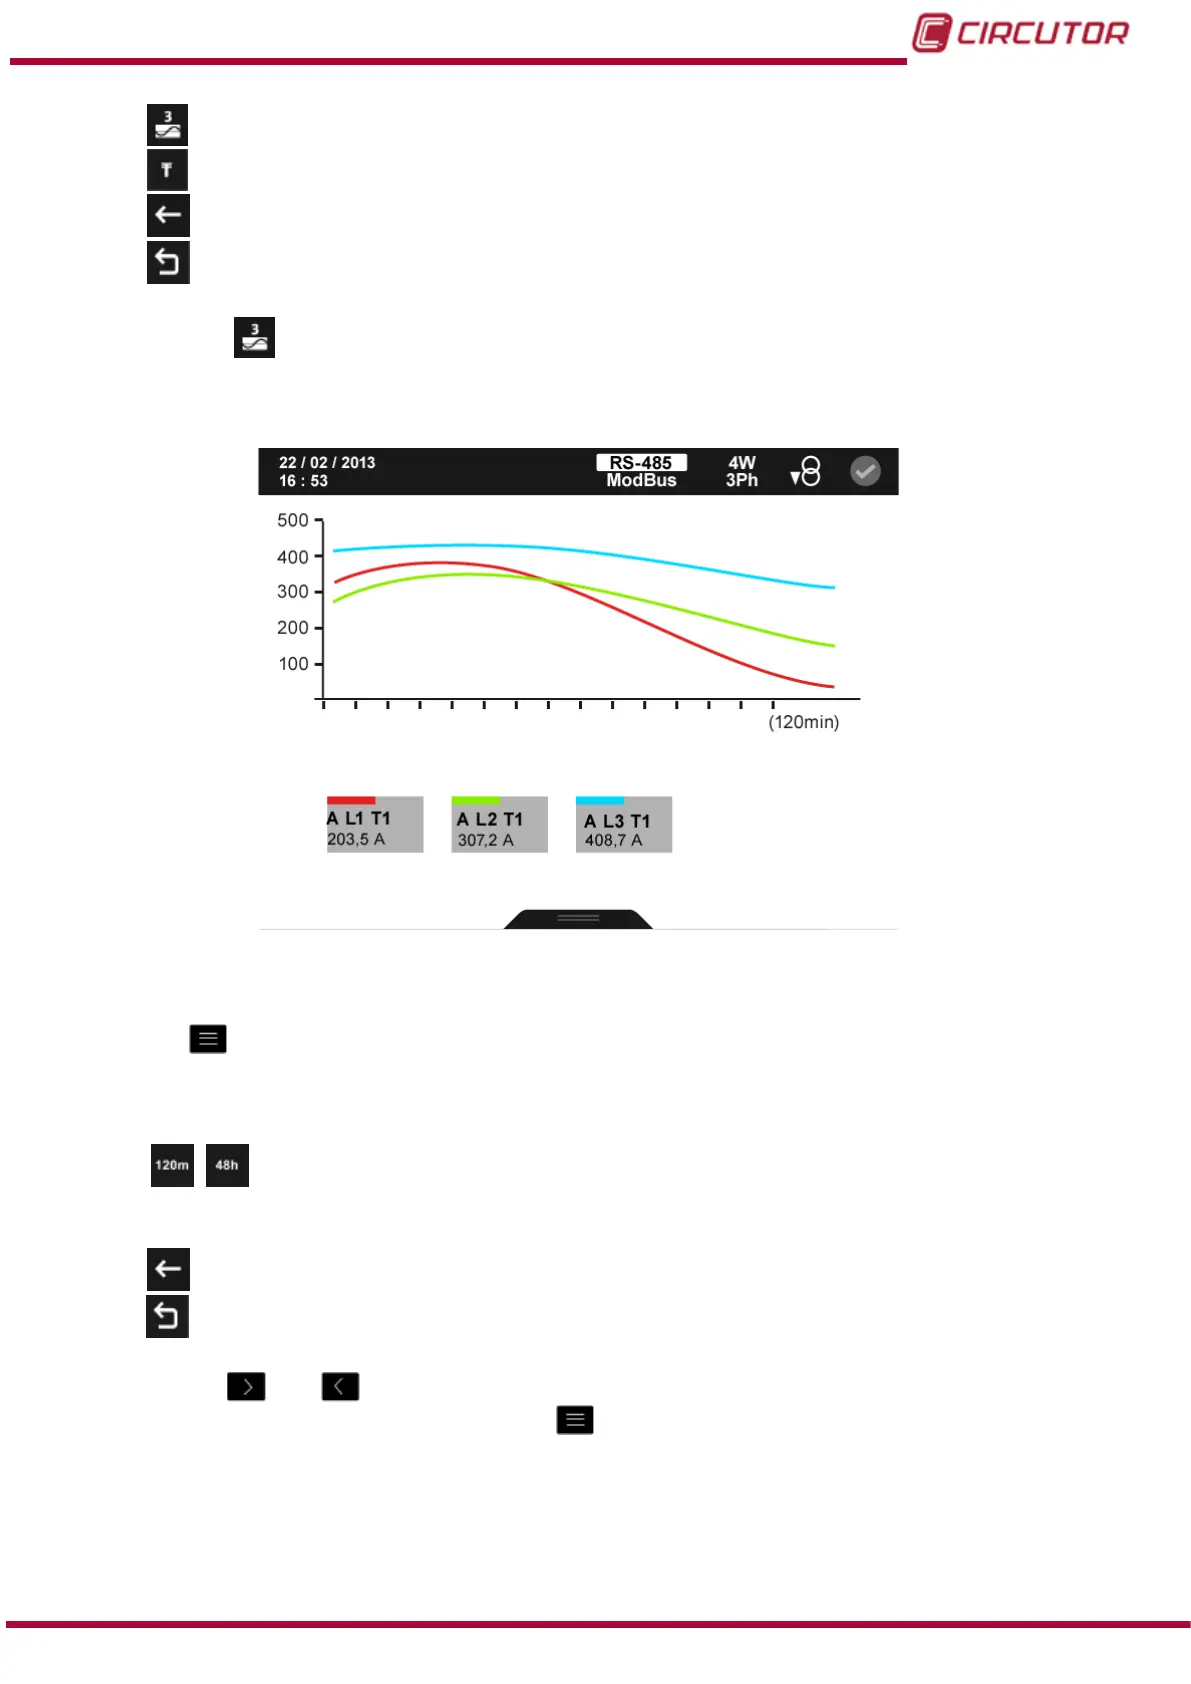
Figure 61 shows the graphical display screen.
Figure 61: Demand parameters, graphical representation (displays 3 parameters).
The menu in the lower area disappears after a few seconds.
Press the
key to display the lower area again.
The lower area menu options are:
, , Select the integration time ( X-axis ) on the graph. The time can be set to 120
minutes or 48 hours.
Note: The option selected is not displayed on the menu.
Back, returns to the demand parameters display menu screen, Figure 60.
Main Menu, back to the main menu, Figure 25.
Use the keys
and to browse the different options.
To access the option selected press the key
.
75
Instruction Manual
CVM-B100 - CVM-B150