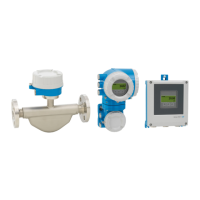
Operation Proline Promass E 500 PROFIBUS PA
180 Endress+Hauser
0
/ ../XXXXXXXX
175.77
40.69 kg/h
-100s
A0016357
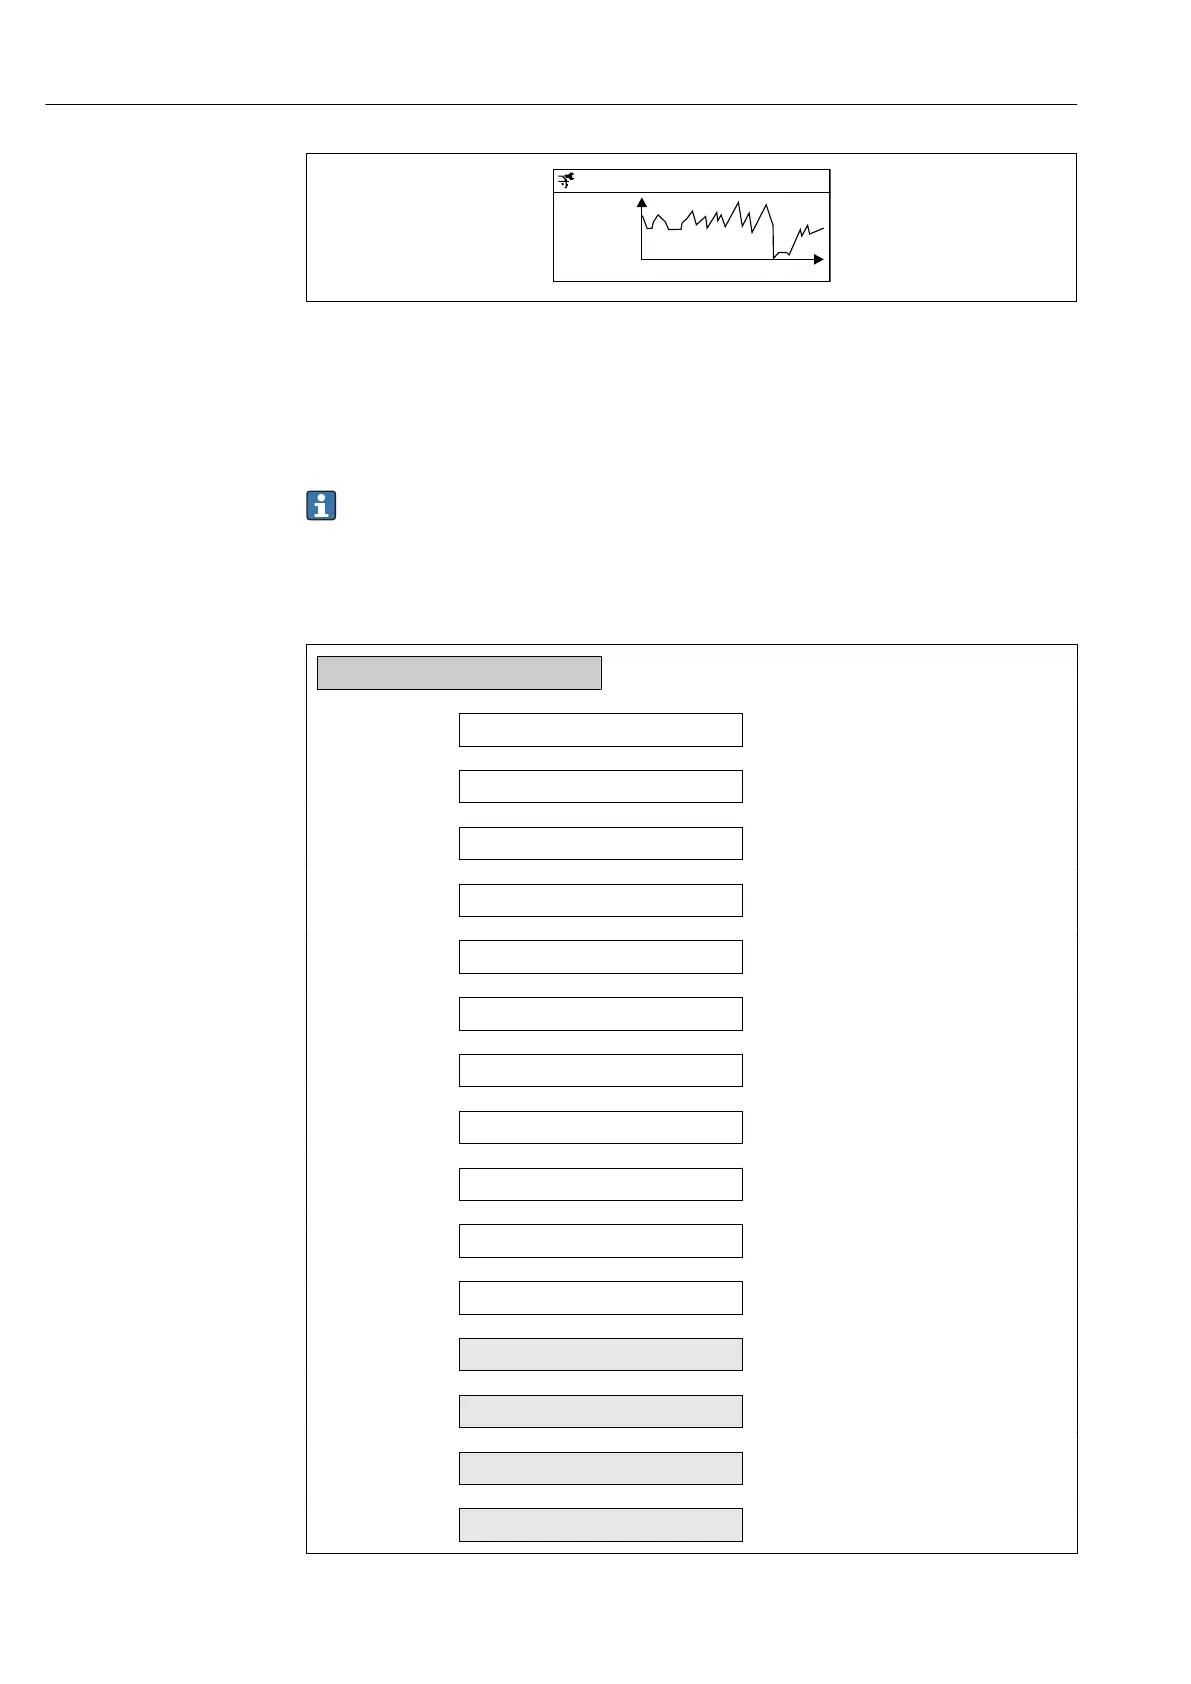
38 Chart of a measured value trend
• x-axis: depending on the number of channels selected displays 250 to 1000 measured
values of a process variable.
• y-axis: displays the approximate measured value span and constantly adapts this to the
ongoing measurement.
If the length of the logging interval or the assignment of the process variables to the
channels is changed, the content of the data logging is deleted.
Navigation
"Diagnostics" menu → Data logging
‣
Data logging
Assign channel 1
→ 181
Assign channel 2
→ 181
Assign channel 3
→ 182
Assign channel 4
→ 182
Logging interval
→ 182
Clear logging data
→ 182
Data logging
→ 182
Logging delay
→ 182
Data logging control
→ 182
Data logging status
→ 182
Entire logging duration
→ 182
‣
Display channel 1
‣
Display channel 2
‣
Display channel 3
‣
Display channel 4